on
Blog Post 1: Exploring Past House Vote and Seat Share
This blog post will be the first in a series of posts for Gov 1347: Election Analytics, a course at Harvard taught by Ryan Enos. Over the course of this semester, I will be building up my electoral knowledge in order to build a predictive model of the upcoming 2022 midterm elections.
Vote Share and Seat Share by State in the 2020 House Election
Let’s attempt to visualize past House election data to get a better sense of the past political landscape and warm up my incredibly rusty R skills. We’ll begin by looking at vote share on a per-state basis:
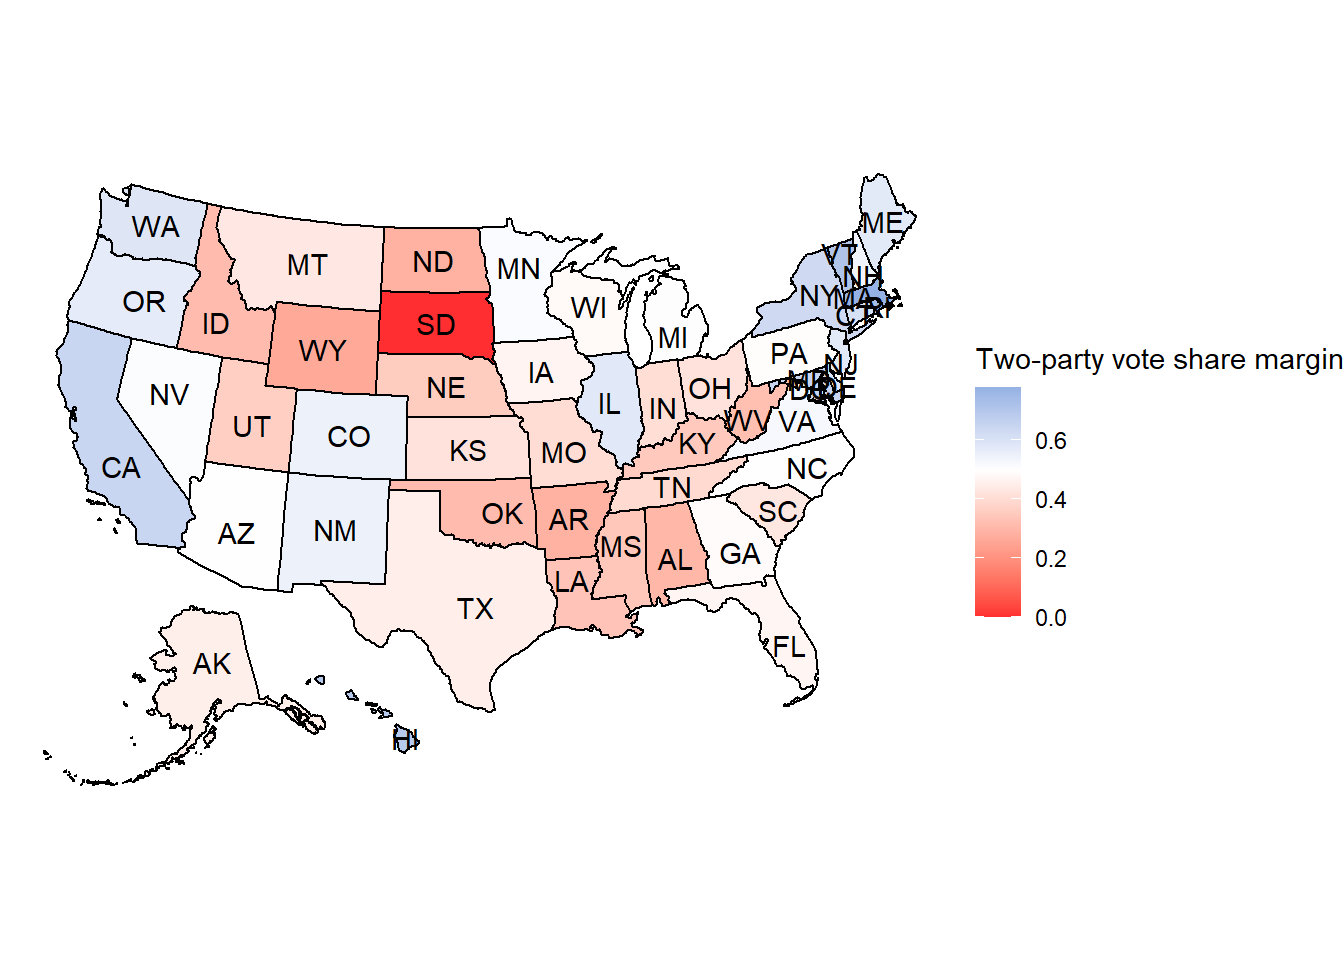
At the state level, it looks like GOP candidates tend to win the popular vote by a larger margin than Democrat candidates. This would suggest that GOP voters turnout at a higher rate in red states than Democrat voters do in blue states. Whether that should be attributed to GOP voters being more partisan than their Democrat counterparts, to structural barriers making it harder for political minorities to vote in red states than blue states, or to some other unknown factor is outside the scope of this exercise, but I find this result quite interesting.
Let’s see what happens when we look at seat share:
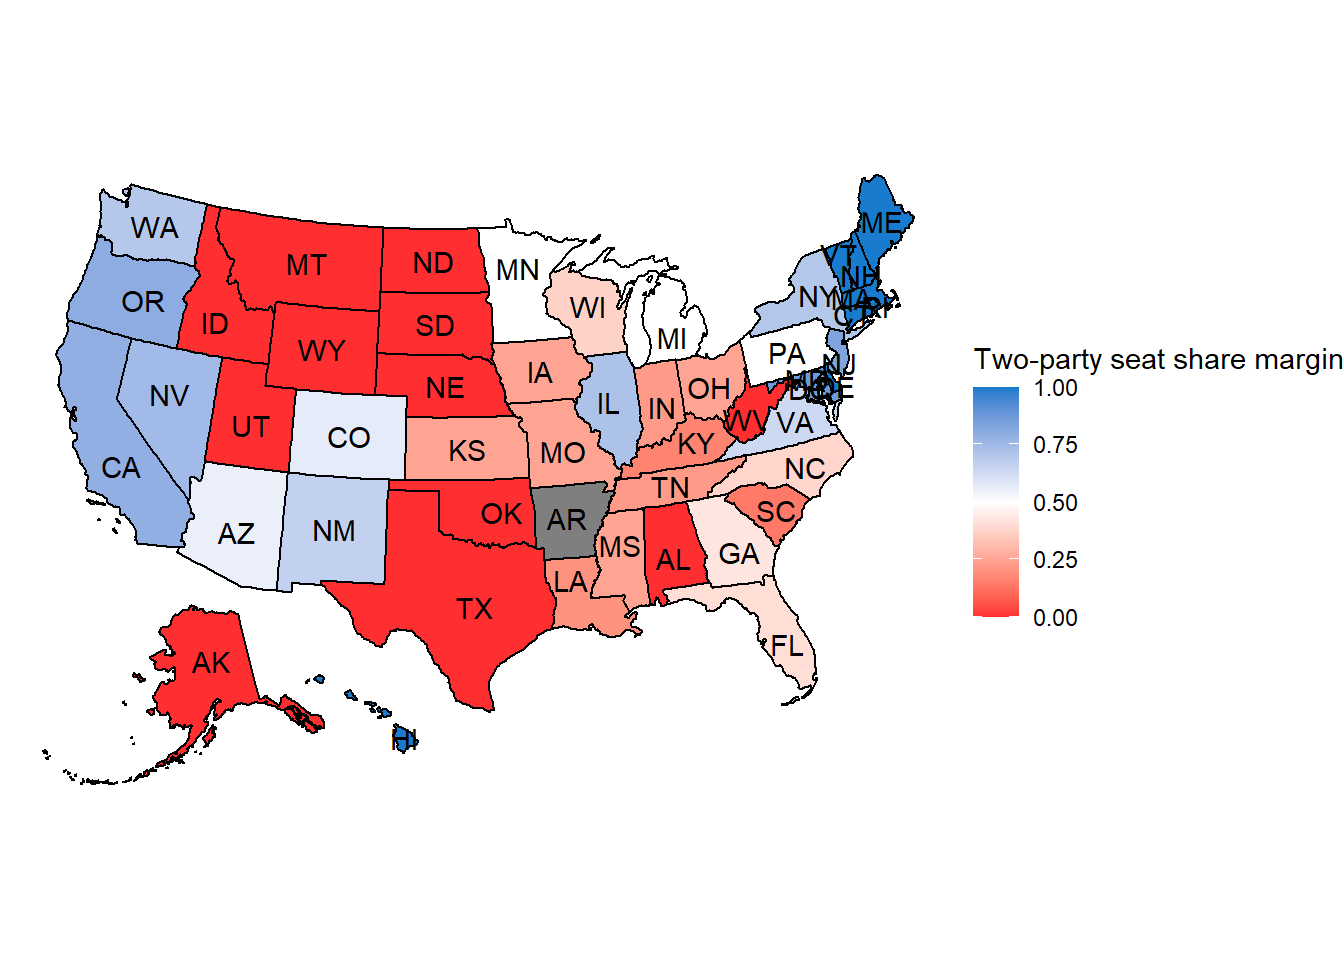
Based off this visualization, it’s clear that GOP candidates win seats within a state by an even larger margin than they did in the popular vote. This suggests that certain structural factors allow more GOP candidates to win seats in slightly red states than Democrats do in slightly blue states.
Takeaways
What are we to make of this data? At a philosophical level, perhaps democracy isn’t working the way we think it should. If one believes that democracy should precisely align with popular sentiment, then one could make the argument that our institutions are in the way of the democratic process. They would be right in a certain respect, but the purpose of this blog post isn’t to make value judgements about gerrymandering, voter id laws, etc.
How does this inform our decision making process when building a model for the upcoming midterm elections? From my perspective, results like this lead me to believe that one needs to be wary of polls and popular sentiment. While these are some of the most obvious sources of predictive data, since it is the people who vote at the end of the day, there seem to be other factors that distort public sentiment and lead to skewed outcomes in the House. At this point in time I would like to try to predict the seats in the house, not the votes for it, so unless I change my mind I must look out for outside factors like this. Recent redistricting is one such factor that remains at the top of my mind.