on
Blog Post 2: Economic Indicators
This week I’ll be looking at some economic indicators to see if they hold any predictive power over past midterm elections. In particular, I am going to compare three models: one that uses only GDP growth in the last quarter before an election as an independent variable, one that uses only RDI growth in the last quarter before an election, and one that looks at both.
Introduction
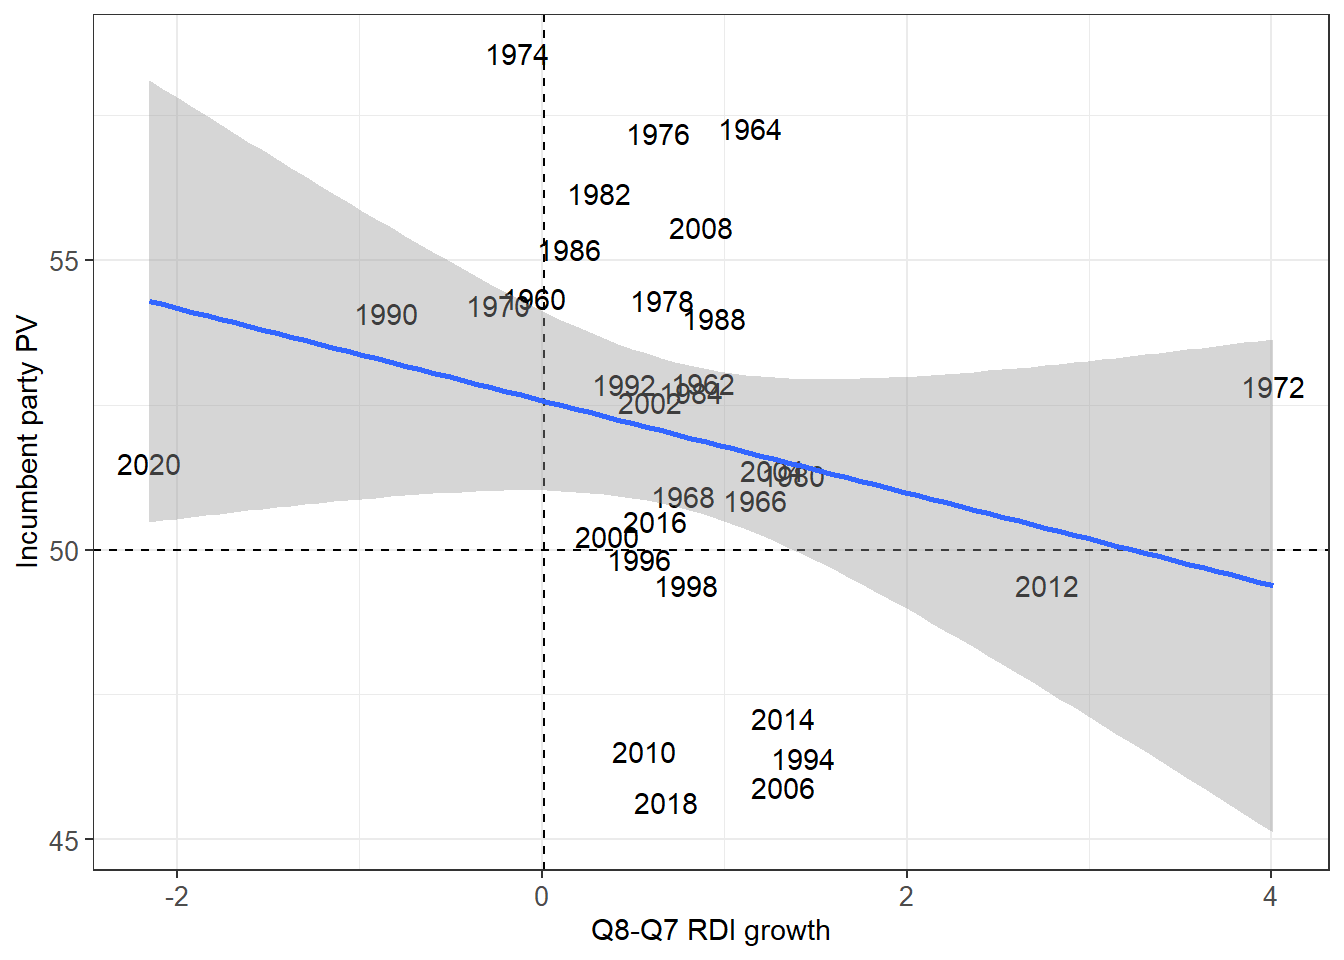
Healy and Lenz, among many others, document how the recent performance of the economy is a very good predictor of popular vote share in the presidential election. Is this true for congressional elections as well? I’ve chosen GDP and RDI as two measures that capture different parts of the economy, with the former capturing overall economic growth and the latter capturing the growth of real disposable income. If voters elect their representatives based on their recollection of the performance of the economy, one would expect voters to reward incumbents during periods of growth and punish them during periods of decline. In other words, the incumbent party’s vote share should increase as the economy grows. Let’s see if this hypothesis holds up when we plot the two single variate models and look at the coefficients of the other multivariate model.
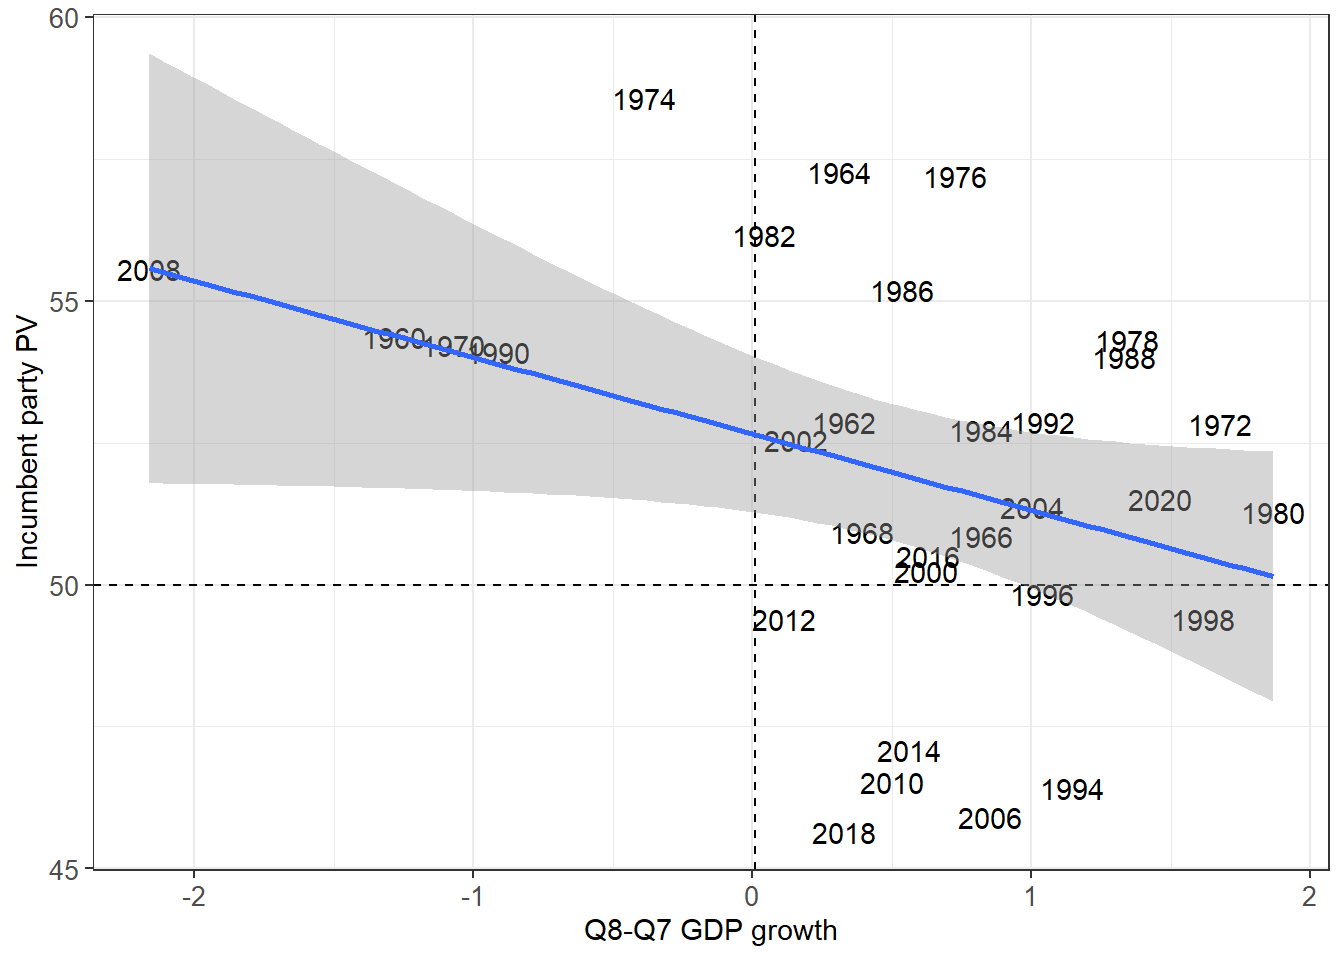
##                    Estimate Std. Error   t value     Pr(>|t|)
## (Intercept)      52.9498204  0.7664654 69.083121 7.904960e-33
## GDP_growth_pct   -1.1884726  0.6915322 -1.718608 9.672574e-02
## DSPIC_change_pct -0.4995784  0.6138014 -0.813909 4.225652e-01
It looks like all three models predict the opposite behavior from what we expected. As the economy performs better, incumbent party vote share decreases. Does this mean that voters actually punish incumbents when the economy does well? Not really. It is important to notice that visually, there does not seem to be a strong correlation among the data points in this direction. We can look at R-squared values for the single variate models and adjusted R-squared values for the multivariate model to get a more formal sense of the power of this prediction.
GDP Model:
## [1] 0.1256595RDI Model:
## [1] 0.05576812Combined Model:
## [1] 0.08485784Takeaways
The above R-squared and adjusted R-squared values are quite low, which means that these short-term changes in economic indicators are not very good predictors for incumbent party vote share in the House. In other words, voters don’t really take the economy into account when choosing a representative, or at least they don’t in the way I’ve chosen to measure it here. When I attempt to predict seat share for the upcoming midterm elections, I’m going to need to look at different factors if I want to accurately predict the outcome, especially if I don’t want to rely on incumbency as my main predictor.