on
Blog Post 3: Polling
This week I will be looking at polls in an attempt to incorporate them into my predictive model of the upcoming midterm elections.
Introduction
In recent years, especially after the 2016 election, the trustworthiness of polls have come under intense scrutiny. I’m sure we all remember our surprise at Donald Trump winning the election despite nearly every major poll predicting a Clinton victory. While many pollsters cited that the results were withing their established margins of error, spectators were left confused. As Gelman and King describe, the results of polls are often quite varied. One thing that comes up time and again with respect to 2016 is non-response bias, i.e. that some groups of individuals may be less likely to respond to polls than others, leading to a warped view of the “ground truth.” Pollsters get around this by assigning different weights to different groups of respondents, but this is an opaque solution that varies between pollsters.
Good Pollsters and Bad Pollsters
Let’s run with the idea that some pollsters might be better at polling than others. In our model, we might not want to include polls from bad pollsters. 538 uses a metric called predictive plus-minus to calculate how accurate a pollster might be in future elections, which is then translated into a letter grade for pollster quality. I’m going to take a look at 538’s ratings of pollster quality in 2018 and 2020 to get a sense of the variation in pollster quality. Note that as predictive plus-minus decreases, pollster quality increases.
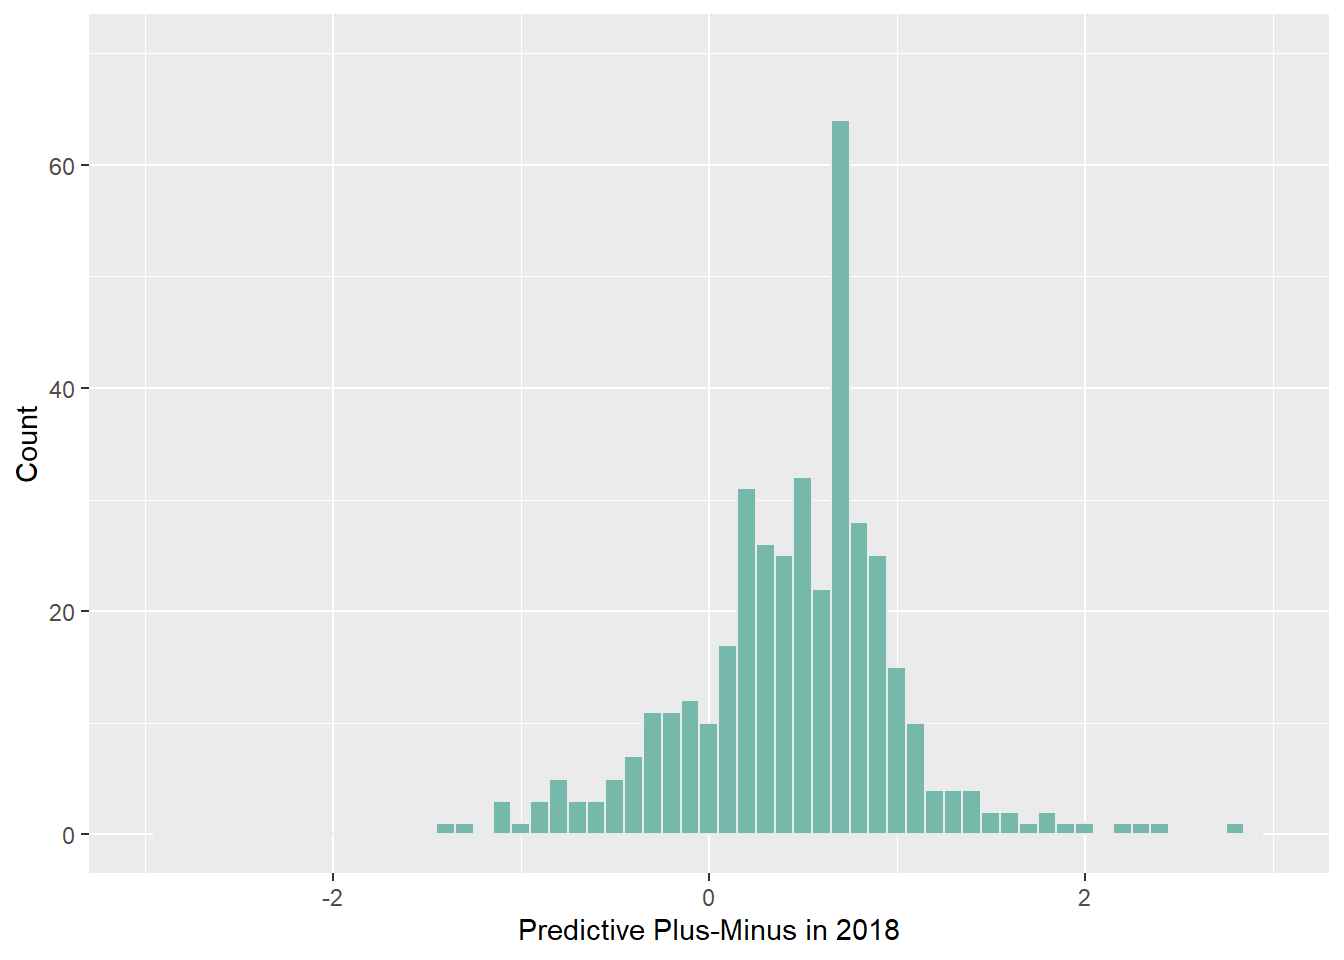
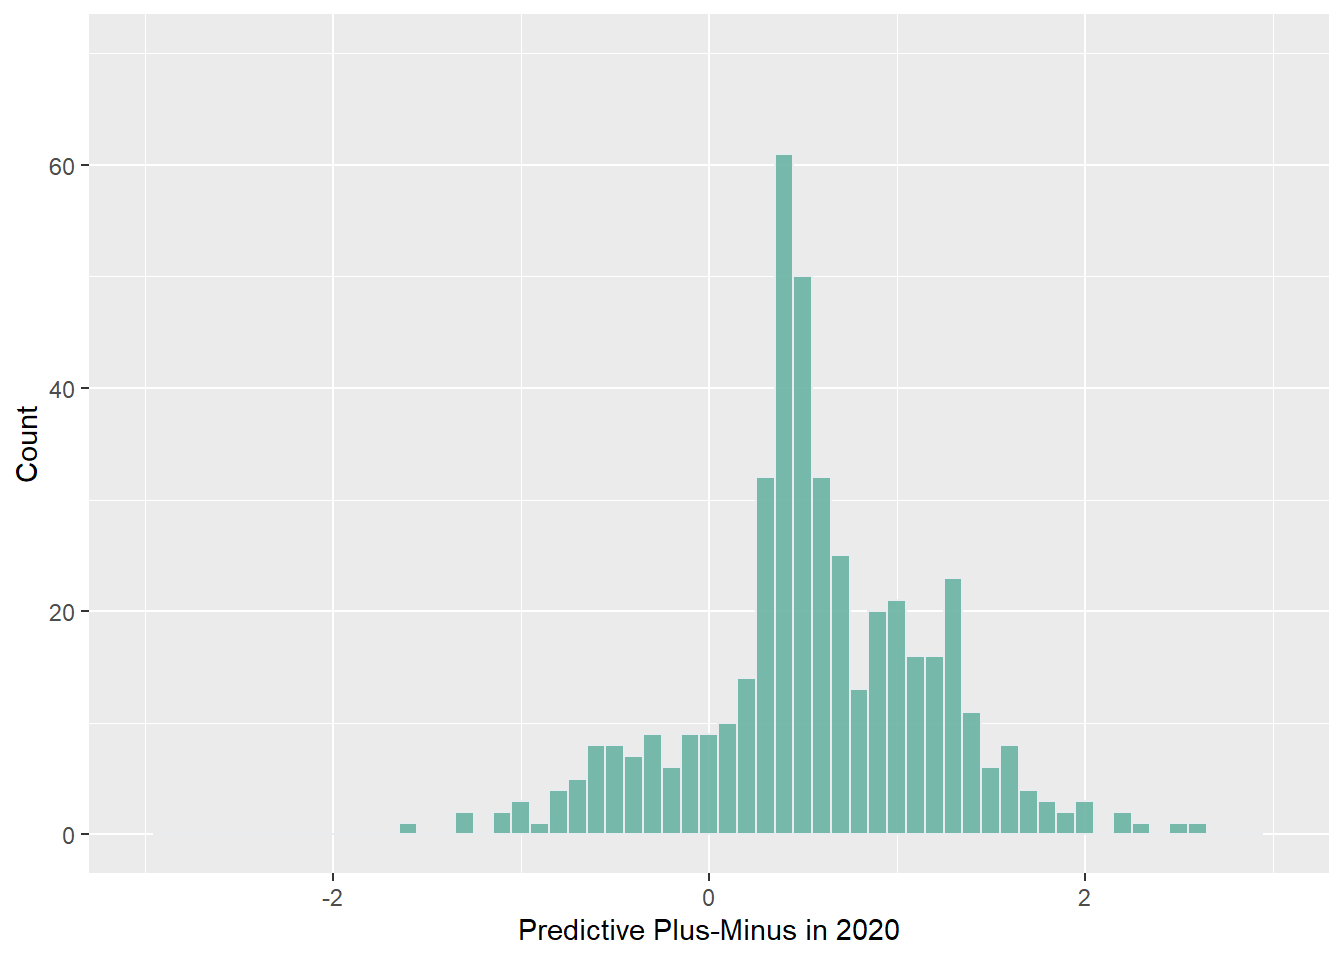 As one might expect, it looks like there are a lot of low quality pollsters out there. Interestingly enough, it also looks like the number of average and low quality pollsters increased between 2018 and 2020. According to the data, it looks like there are 57 more pollsters in 2020 than in 2018, so that would likely account for this increase. High quality pollsters seem to have remained stable in terms of numbers, but it looks like they have on average gotten better at polling.
For my model, I’ll stick to using high quality and average quality pollsters only. I’ll include B- pollsters and above. 538’s cutoff for a B- appears to be a predictive plus-minus of 0.6, which seems pretty good to me. I’m also going to run with the idea that polls taken closer to the election should be weighted heavier than ones taken farther away.
*** At this point, other things in my life came up and I had some trouble wrapping my head around how to incorporate polls into my model for seat share. Apologies for not finishing the blog this week but hopefully I’ll be able to make a robust model for next week.