on
Blog Post 4: Expert Predictions and Incumbency
This week I’ll be looking at expert predictions and incumbency to help build my model for the upcoming 2022 midterm election. I’ll start by assessing the accuracy of expert predictions in the 2018 midterm elections before incorporating incumbency and potentially expert predictions into my model.
Expert Predictions
I am not alone when it comes to attempting to predict the outcomes of elections. There are so many different media outlets, researchers, think tanks, and political hobbyists who attempt to predict the outcomes of elections. I’ll be using the predictions from three different sources: the Cook Political Report, Inside Elections, and Larry Sabato’s Crystal Ball. While these sources ascribe descriptive values to the outcome of races (solid, lean, etc) all three of them are widely-known and widely respected. What surprised me is that some outlets like FiveThirtyEight incorporate these predictions into their models. Perhaps what these experts are able to capture are things like candidate quality which can be hard to determine based on other data that is out there.
When experts predict the outcome of a race, they give it a descriptor that can roughly correspond to different voteshares. I’ve chosen to give the following Democrat voteshares to the following predictions:
Solid Democrat - 60% Likely Democrat - 55% Lean Democrat - 52.5% Tilt Democrat - 51.5% Toss-up - 50% Tilt Republican - 48.5% Lean Republican - 47.5% Likely Republican - 45% Solid Republican - 40%
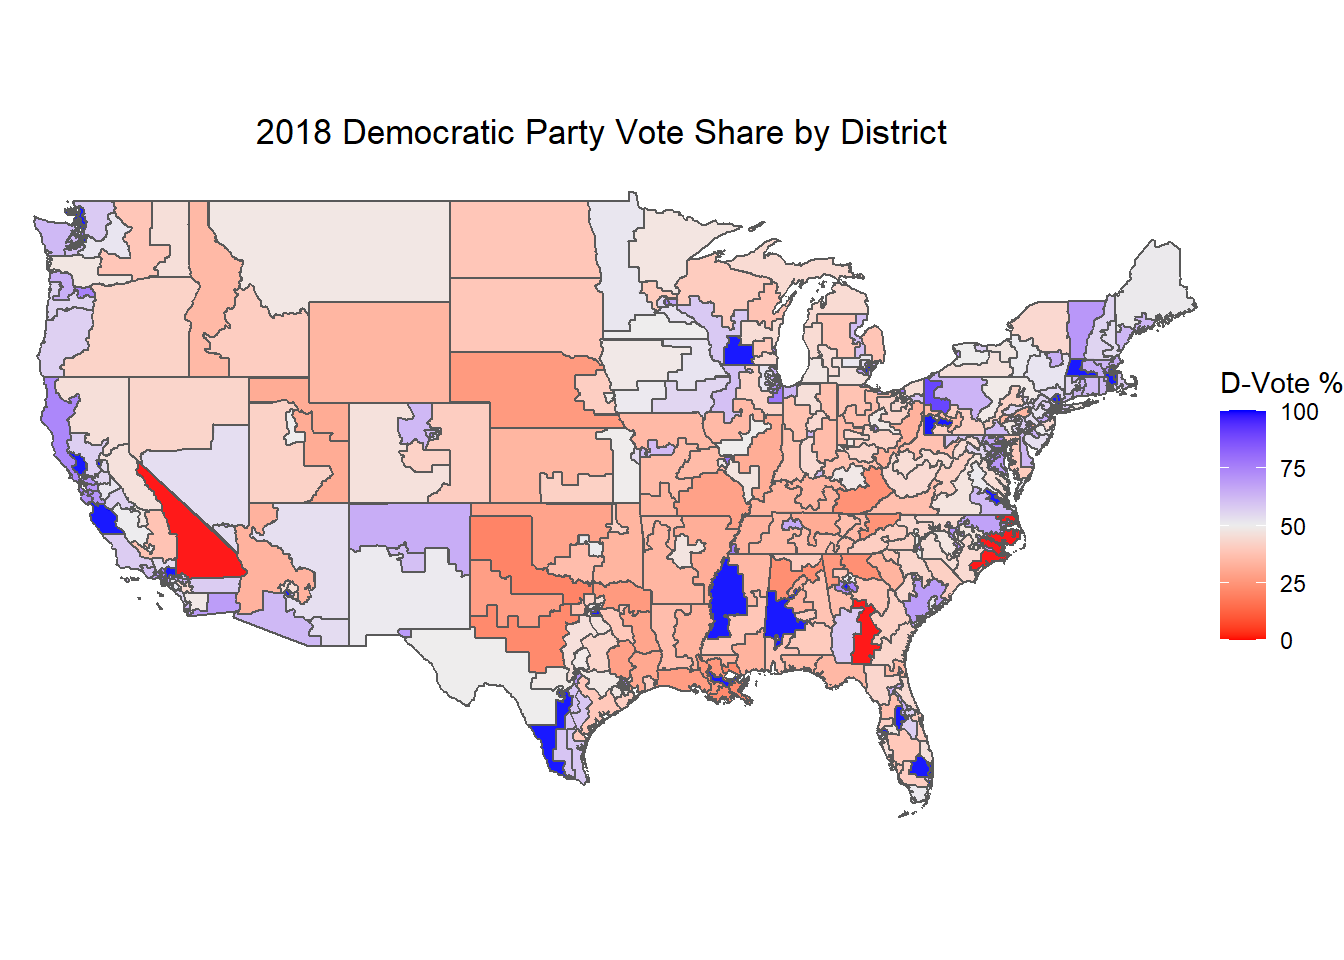
Let’s look at some maps. The following map shows the two party vote share by district in the 2018 house midterm election:
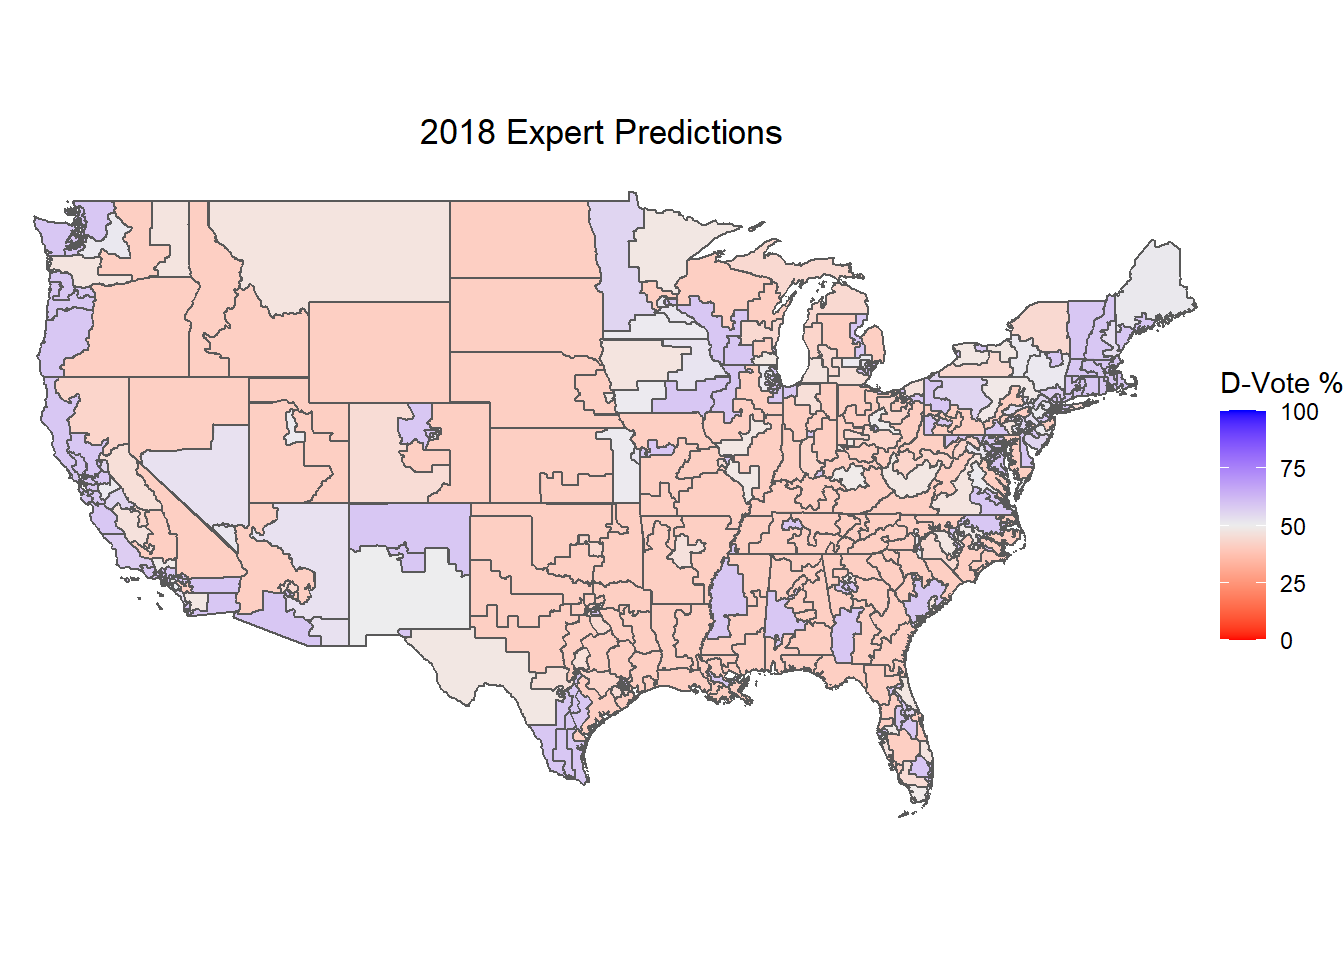
Plotted below is the average of the expert predictions for each district using the voteshare values I ascribed.
And below is a map that shows the difference between expert predictions and actual voteshare outcomes. Note that positive (blue) values indicate that Democrats fared better than experts predicted, and negative (red) values indicate that Democrats fared worse than experts predicted.
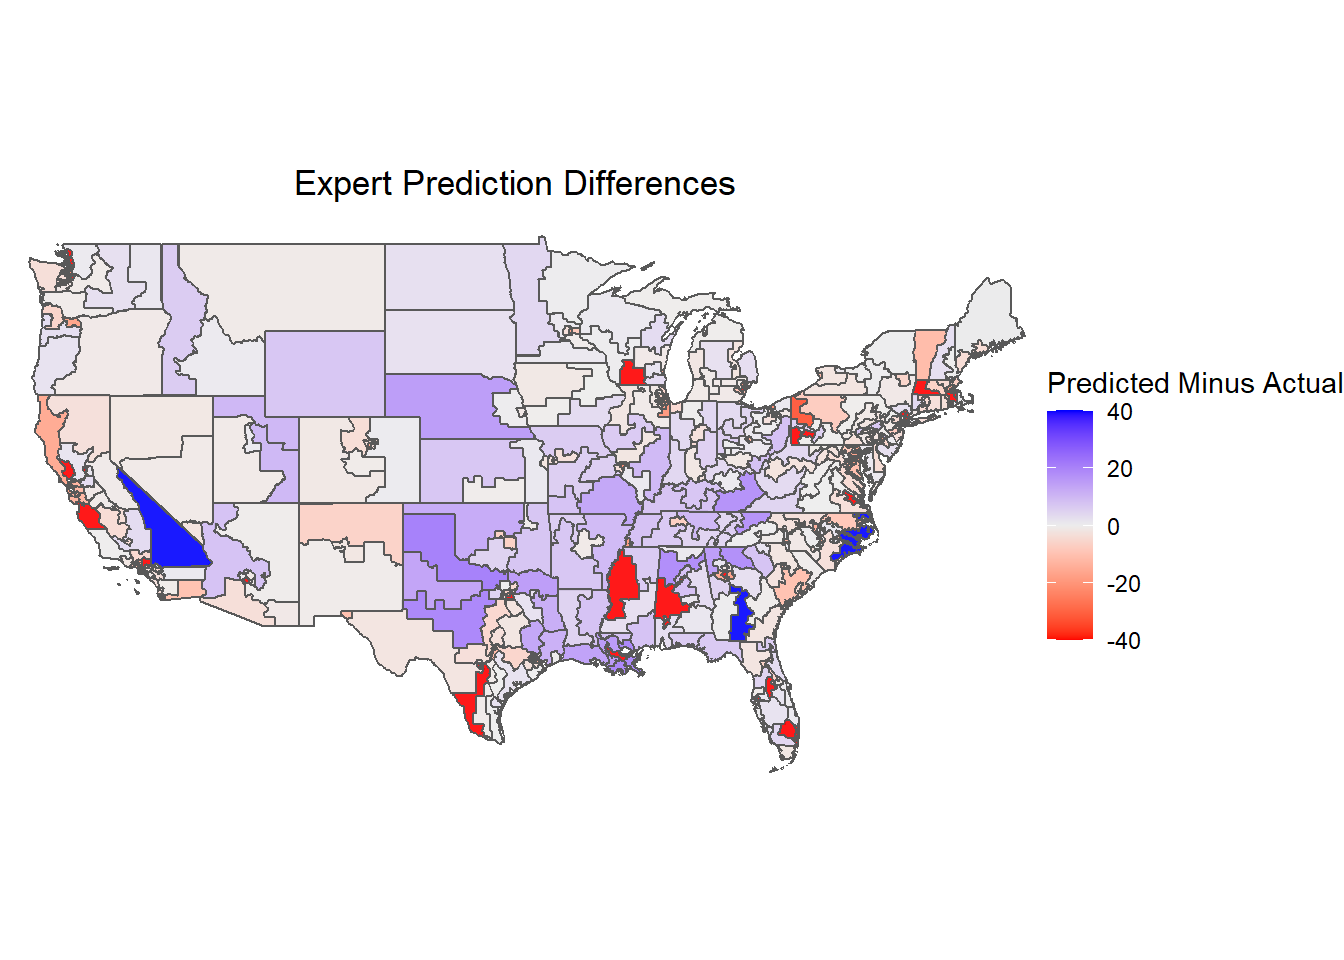
As we can see, it looks like Democrats did a little bit better than experts predicted in many of the districts in the 2018 midterm election, with only a few races where Democrats fared worse than expected. There were a few districts which were labeled as strong Democrat/Republican that had a difference of 40 points. While at first it may seem like a gross inaccuracy, these districts are ones where a candidate ran uncontested. Based on how I coded the “strong” values, uncontested races will always put out a margin difference of 40 points. This highlights the arbitrariness of my ascribed values but doesn’t take away from the overall trends of these expert predictions, namely that Democrats exceeded expectations.
Adding Incumbency and Expert Predictions to My Model
For last week’s blog post, I wasn’t able to add polling data to my model. I’ve revisited it here. I’ve chosen to look at national generic polls for two reasons. First, especially if we’re going back a few decades, district level and other kinds of polls become much harder to find. I would like to have a lot of observations in order to improve my model. Second, most people don’t know who their House representative is, so generic polls are often the best way to tell who they will vote for their House election, if they decide to turn out. As we’ve discussed previously, polls get more accurate the closer you are to the start of the election since people start making up their minds as the election approaches. What I’ve done is average the partisan support of all polls taken 45 days or fewer before the election for each election cycle.
For my model, I’m first going to predict the seat share of the incumbent president’s party in the House by looking at whether the incumbent majority party in the House is the same as the president’s party, whether an election is a midterm, and GDP growth in the last quarter before the election as an economic indicator. As I’ve discussed in previous weeks, observers of politics have noted that the president’s party tends to lose seats during the midterm election, especially when the economy is doing poorly in the eyes of voters. I include the incumbent party in the house because I want to see whether voters are sensitive to the majority party of the House itself when voting. I’ve opted not to include expert predictions because I think using expert predictions would be cheating in some way and somewhat difficult to implement given my national approach. It could also expose my model to significant bias if experts are all biased in the same direction, so I’ll stick to my own predictions for now.
Below is a stargazer table which looks at the coefficients of my models:
##
## Model Coefficients
## ====================================================================================
##                                                      Dependent variable:
##                                          -------------------------------------------
##                                           Seatshare of Incumbent President's Party
##                                             (1)        (2)        (3)        (4)
## ------------------------------------------------------------------------------------
## House Majority Party Same as President               0.117***              0.053***
##                                                      (0.020)               (0.018)
##
## Midterm Election                          -0.058**  -0.068***              -0.033**
##                                           (0.028)    (0.020)               (0.015)
##
## GDP Growth Pct                             -0.008     -0.009                -0.010
##                                           (0.013)    (0.010)               (0.007)
##
## Incumbent President's Party Poll Support                        1.291***   0.964***
##                                                                 (0.136)    (0.158)
##
## Constant                                  0.527***   0.466***   -0.148**    0.008
##                                           (0.022)    (0.019)    (0.068)    (0.076)
##
## ------------------------------------------------------------------------------------
## Observations                                 37         37         36         36
## R2                                         0.119      0.569      0.725      0.809
## Adjusted R2                                0.068      0.530      0.717      0.785
## ====================================================================================
## Note:                                                    *p<0.1; **p<0.05; ***p<0.01
These significance codes are really promising, although they do make sense. Like in week 2, it looks like GDP doesn’t have much to do with how people vote in House elections. This model predicts that when the incumbent House majority party has the same party as the president, that party will get increased seatshare. This could be the model picking up on periods of time when one party was incredibly successful in getting elected and predicting this would have a lingering effect, which at least makes sense intuitively. Likewise, it also predicts that the president’s party does worse during midterm elections with a high significance code. Similarly, doing well in the polls seems to predict electoral wins with a high significance code.
Now let’s look at my predictions using the 2nd and 4th models:
predictions## model incumb_model combined_model
## 1 prediction 0.5233035 0.5239296It looks like both my incumbency only model and my combined incumbency and polling model predict the Democrats to win the House election with an overall 52.3% seatshare. Hopefully my next post will include some interesting new changes to tighten this up a bit as I personally am not too sure the Democrats will maintain their current House majority through the midterms.