on
Blog Post 5: The Air War
This week I’ll be looking at televised political ads to see if we can learn more about how campaigns work and whether their actions are correlated to any electoral gains.
Introduction
Unlike fundamentals that I’ve looked at in past weeks, the “air war” is something within the control of campaigns. Candidates can choose how much of their campaign budget to dedicate to political ads, along with where and when to air them. When it comes to the actual effects of political ads, the literature is quite lukewarm on them. According to Gerber et al, political ads can help shape voter preferences, but only in the short term. There is also the theory that conflicting ads cancel each other out, so campaigns are in a constant battle to out-advertise their opponents.
Uneven Distribution of Political Ads
Political ads don’t appear on tv in every district. From a financial perspective, it doesn’t make any sense to spend money on ads in a district that you’re already going to win, so campaigns tend to only air ads in the most competitive districts. From another perspective, it might not make sense to air an ad if you’re a campaign trying to mobilize a group of voters who don’t watch tv very often, such as younger voters. To demonstrate this, let’s see which districts in the 2018 midterm elections received televised political ads:
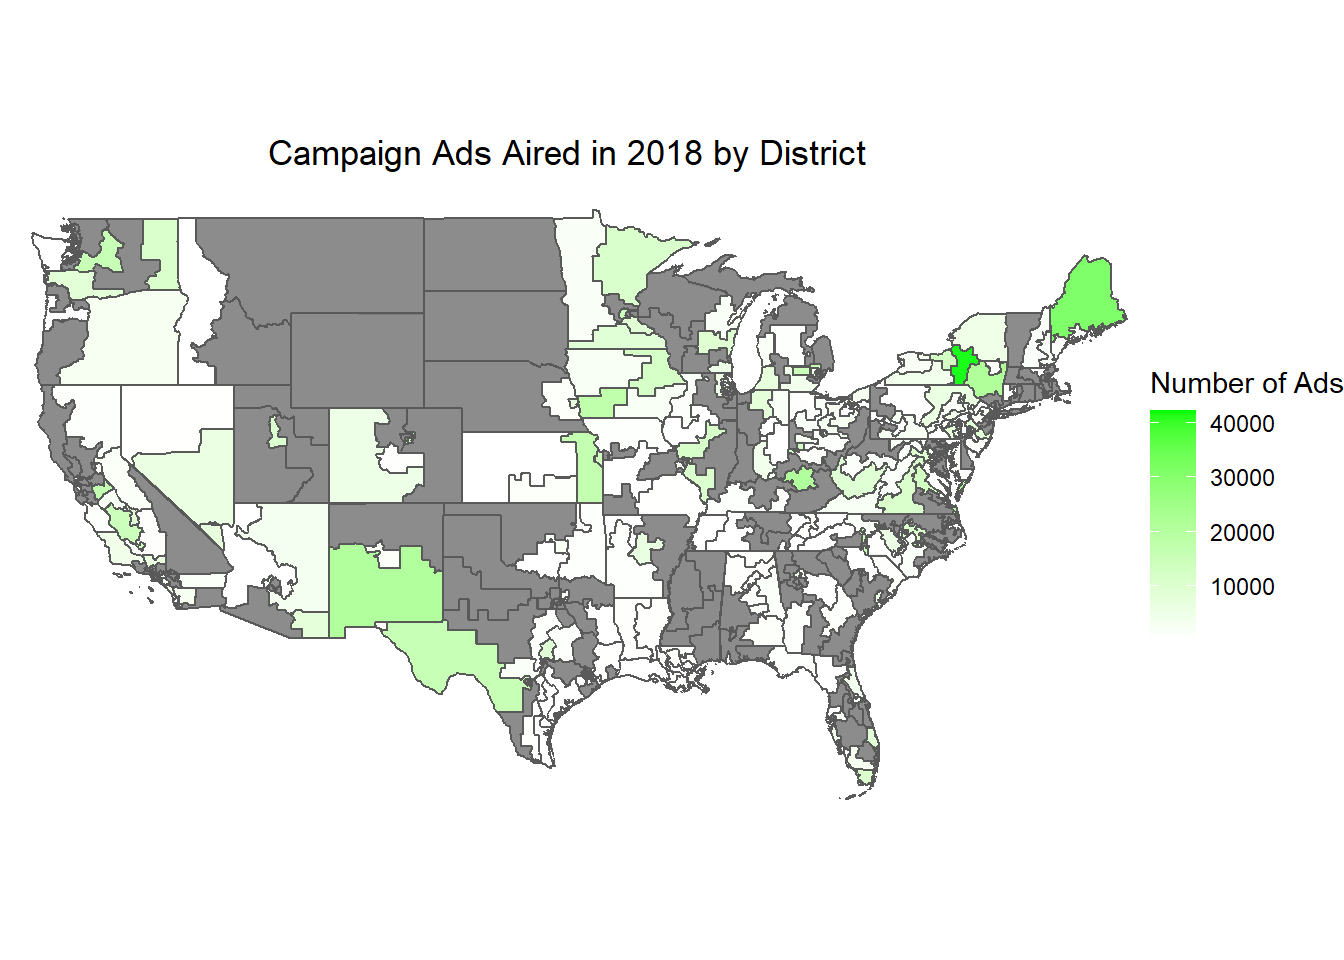
As we can see here, there are many districts where no campaign ads were aired, and many more where there weren’t that many ads aired when compared to some other districts. What about our assumption that campaigns don’t air ads in noncompetitive districts? Let’s take a look at the partisan ratios of ads aired by district:
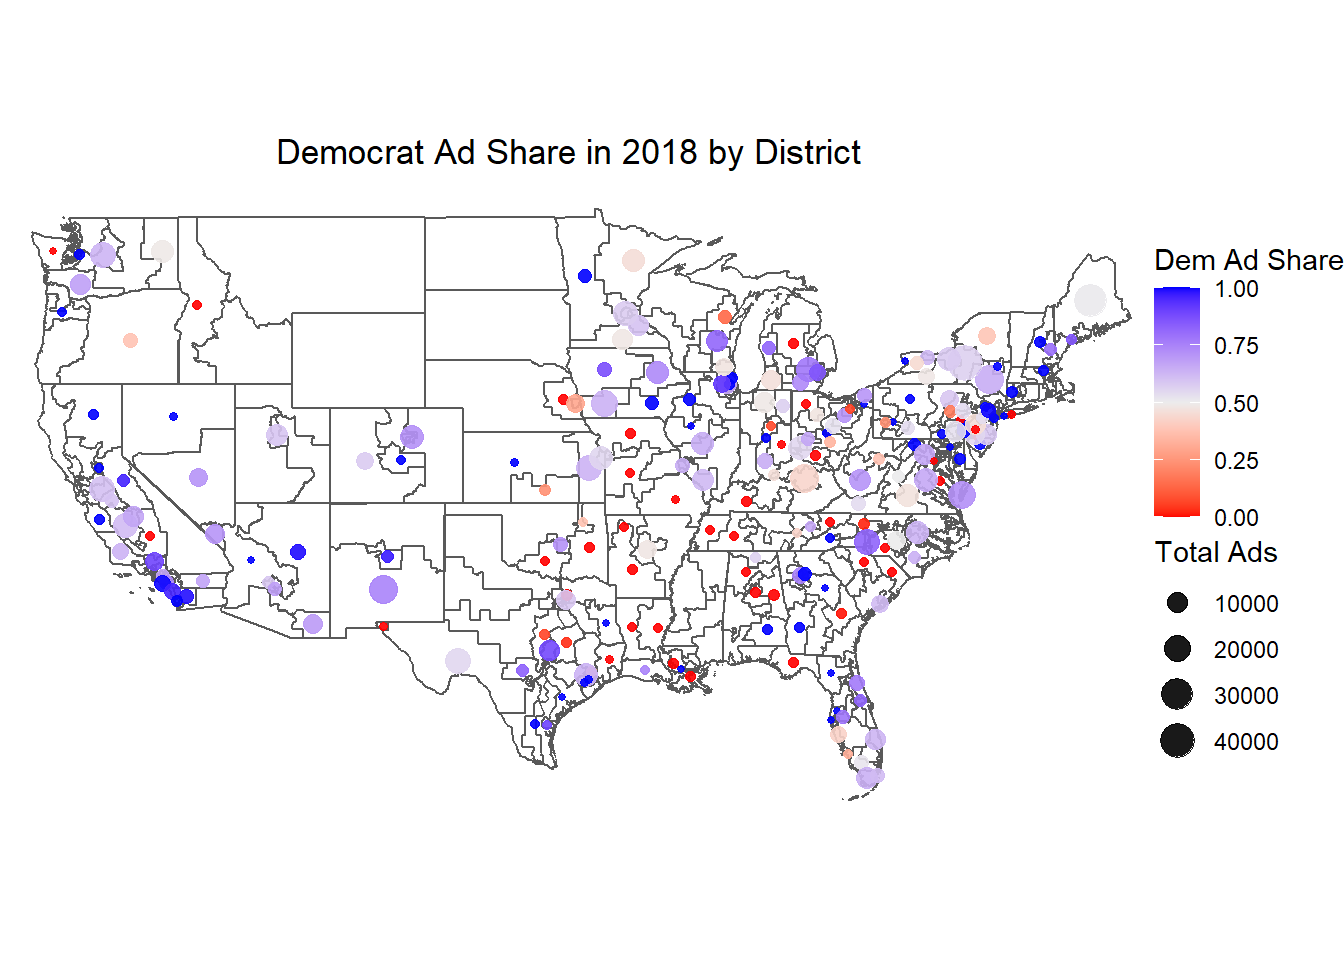
It seems like many of the districts where political ads were aired saw a lot of them, lending credibility to the idea that campaigns focus ads on competitive districts. Interestingly, most of these districts with lots of ads–perhaps about 15,000 or so ads during the 2018 election cycle–saw a slightly higher proportion of Democrat ads over Republican ads. Since this was the 2018 midterm election, this lines up with the anti-Trump rhetoric and the Democratic Party’s efforts to mobilize voters and swing long-help GOP seats. There were also quite a few districts that saw a small amount of ads, and most of these had either mainly Democrat ads or mainly Republican ads, suggesting that these were less competitive districts overall.
Making a Model
To build a district-level model that incorporates this data, a lot of filtering needs to be done. We only have access to data from 2006 to 2018, and I want to make sure I only make predictions using districts that have “enough” data, so I arbitrarily decided to only look at districts with 4 or more years of data available. I then attempted to predict Democratic vote share in each district using the ad data from 2018 as more of a proof of concept than anything. Let’s look at coefficients and adjusted r-squared before we look at actual predictions.
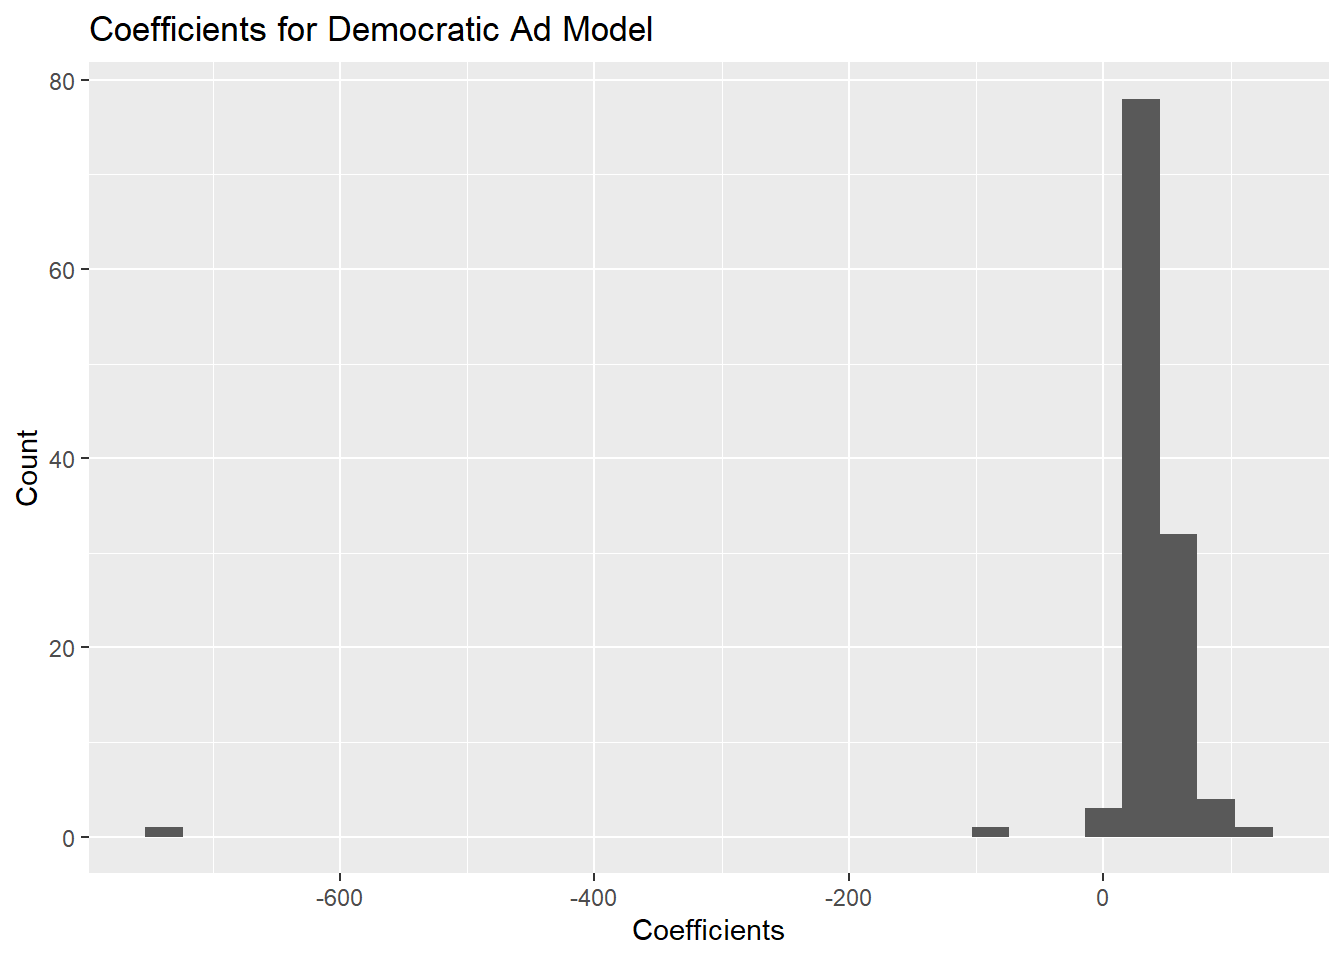
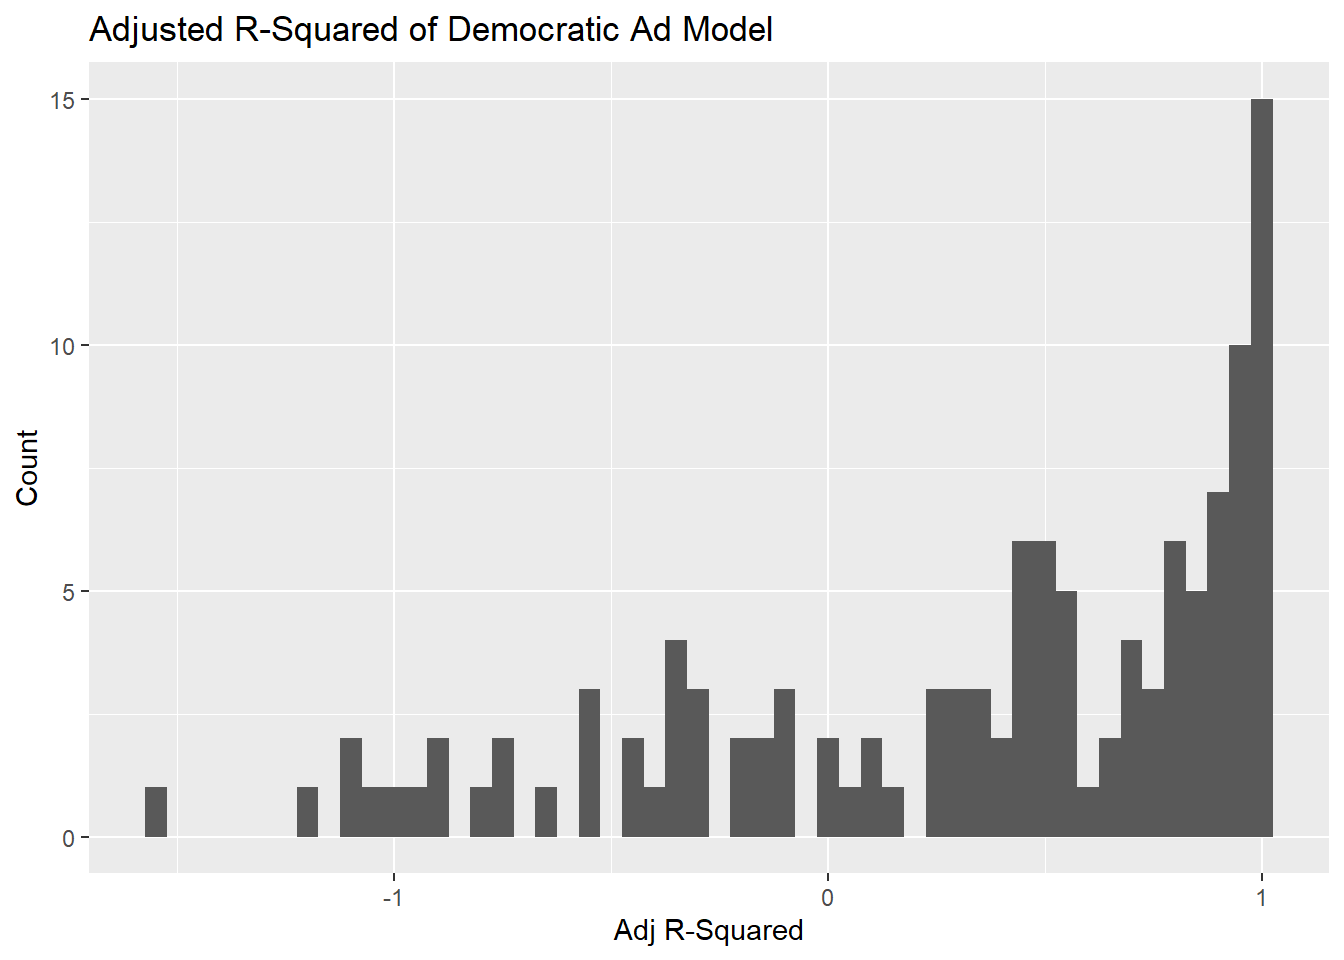
At this point it’s clear that this model is not working how it should. There are coefficients in the negative 700’s, adjusted r-squared values of both 1 and -1, and most of these coefficients and values are outside of acceptable ranges. While I could incorporate this into an actual prediction, I think it’s safe to say that incorporating advertisement would be quite futile given the limited available data, and I would assume that any additional terms like incumbency would simply override these factors.