on
Blog Post 6: Ground Game
This week I’ll be looking at the ground game at the district level, taking a pooled approach to my model where I run predictions of every congressional district in the country and tally their results in order to get a national seatshare prediction. Last week I did something similar with ad data on a few districts, so as a proof of concept I’m going to try it again with turnout data since it’s available for all districts. I’m also going to be ignoring redistricting for now because that’s a can of worms I do not want to open right now.
Introduction
When we think of political campaigns, we generally think of them serving two main functions when it comes to securing votes. The first is to convince undecided voters to agree with their ideas, and the second is to motivate people to turnout and vote on election day. As we have seen in literature like Darr and Levendusky, the jury is still out when it comes to whether campaigns are effective at convincing undecided voters to join their cause, but pieces like Enos & Fowler show that campaigns can be quite effective at motivating voters to turnout on election day. There’s a lot of popular wisdom surrounding turnout that would suggest Democrats tend to be favored by higher turnout. As a result, recent moves by Republican officials to create more barriers to vote have been opposed by many voters both on principle and in practice. If high turnout favors Democrats, then attempts to artificially lower turnout would favor Republicans. The issue of voter suppression is important regardless of whether it has any significant electoral impact, but I wanted to highlight this discourse. Regardless, I’ll be building my model this week with a similar outcome variable as previous weeks, since I want to see if I can incorporate this approach for my final prediction.
Turnout Model
To that end, I built a very simple model that predicts voteshare of the incumbent president’s party as a function of district-level turnout and whether the incumbent House representative is a member of the president’s party. For open races I have decided to code both candidates as challengers, so for this incumbency variable all open races will indicate that the incumbent representative is not a member of the sitting president’s party. While there is always an incumbent party and a challenger party, even in open races, I believe that having a new candidate is enough of a change that they should not be classified as incumbent. I may revisit this coding decision later but this is the decision I’ve made for this week. As a warning, I’m only looking at data from 2012 to 2022 since that is the farthest back our citizen voting age population (CVAP) data goes for the district level. Anything before that is made too messy because of redistricting, but given that there is only up to 5 data points for each district, there will probably be a lot of uncertainty for this model as with last week’s. I’ve also opted not to include expert predictions because there are too many districts that don’t have any expert predictions for them.
Let’s look at some histograms of summary statistics for my model:
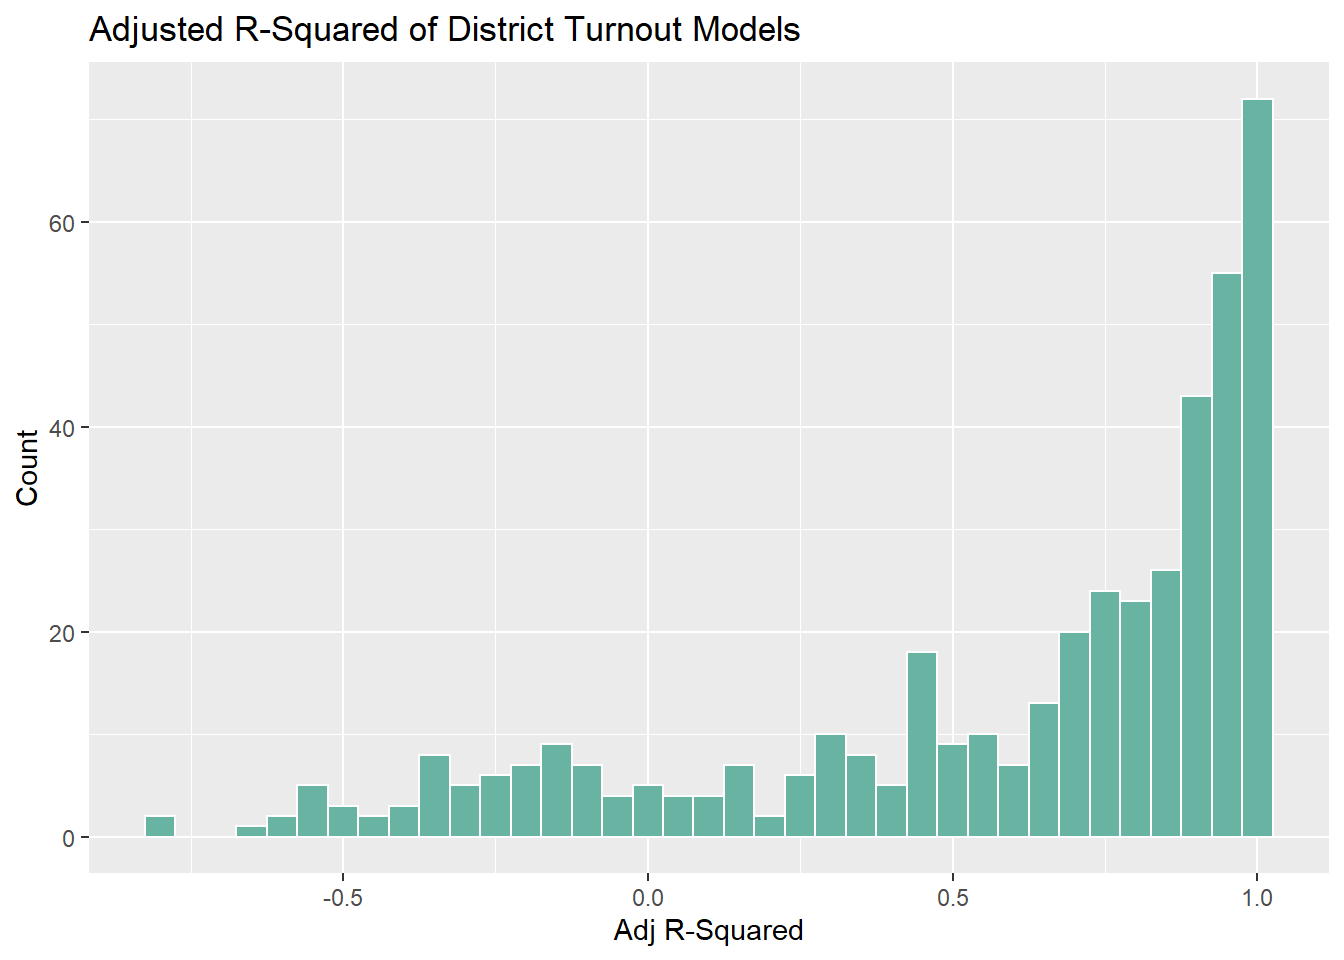
As with last week, the adjusted r-squared values do not look good. There’s a lot of overfitting and there’s also a troubling amount of negative values as well. I’m going to blame this on my very few data points and move on to coefficients. Note that the red line represents the median value for each coefficient:
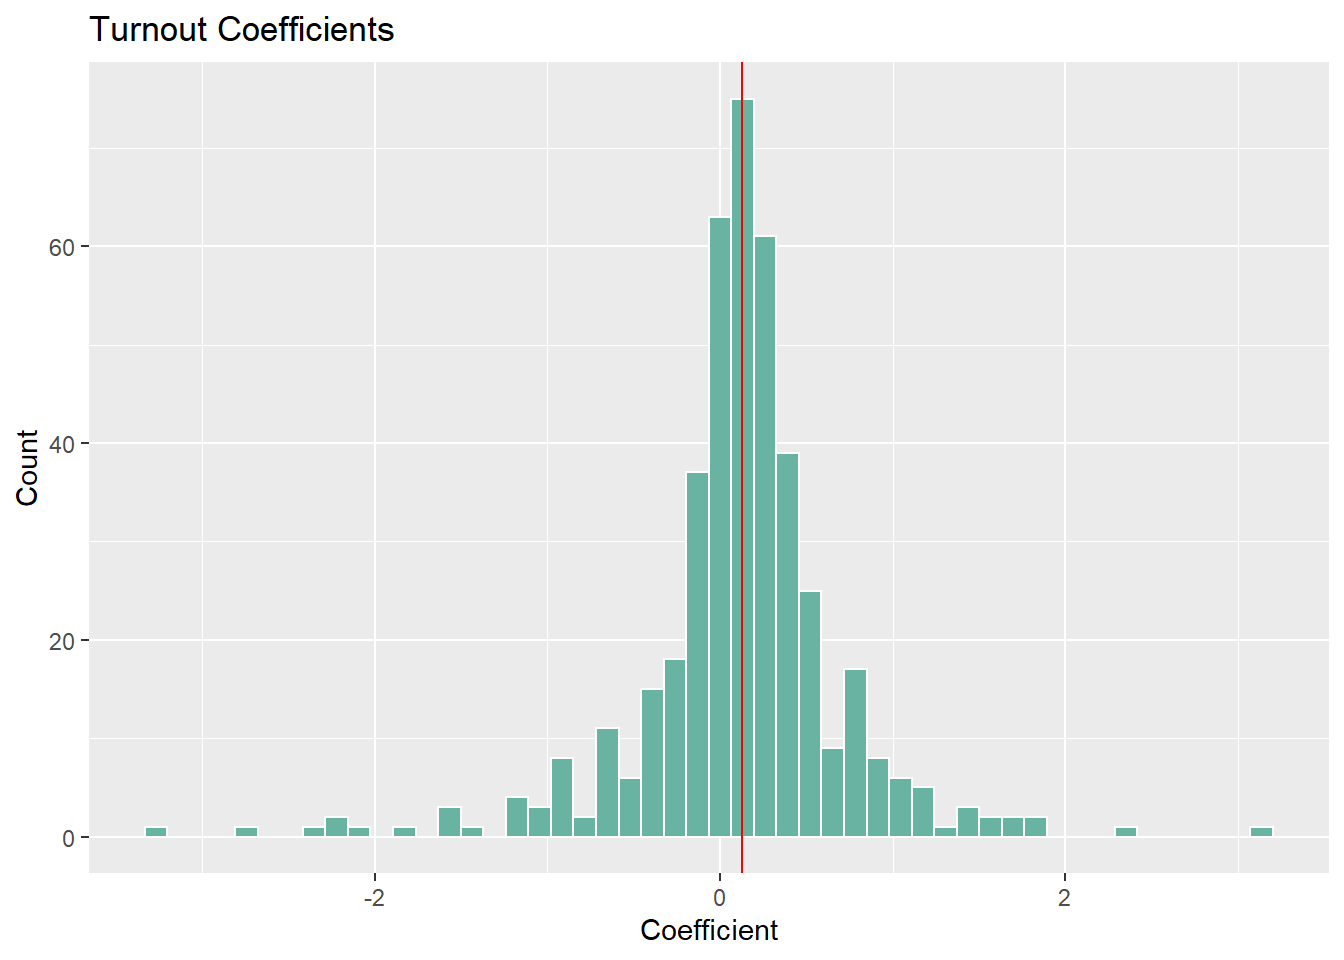
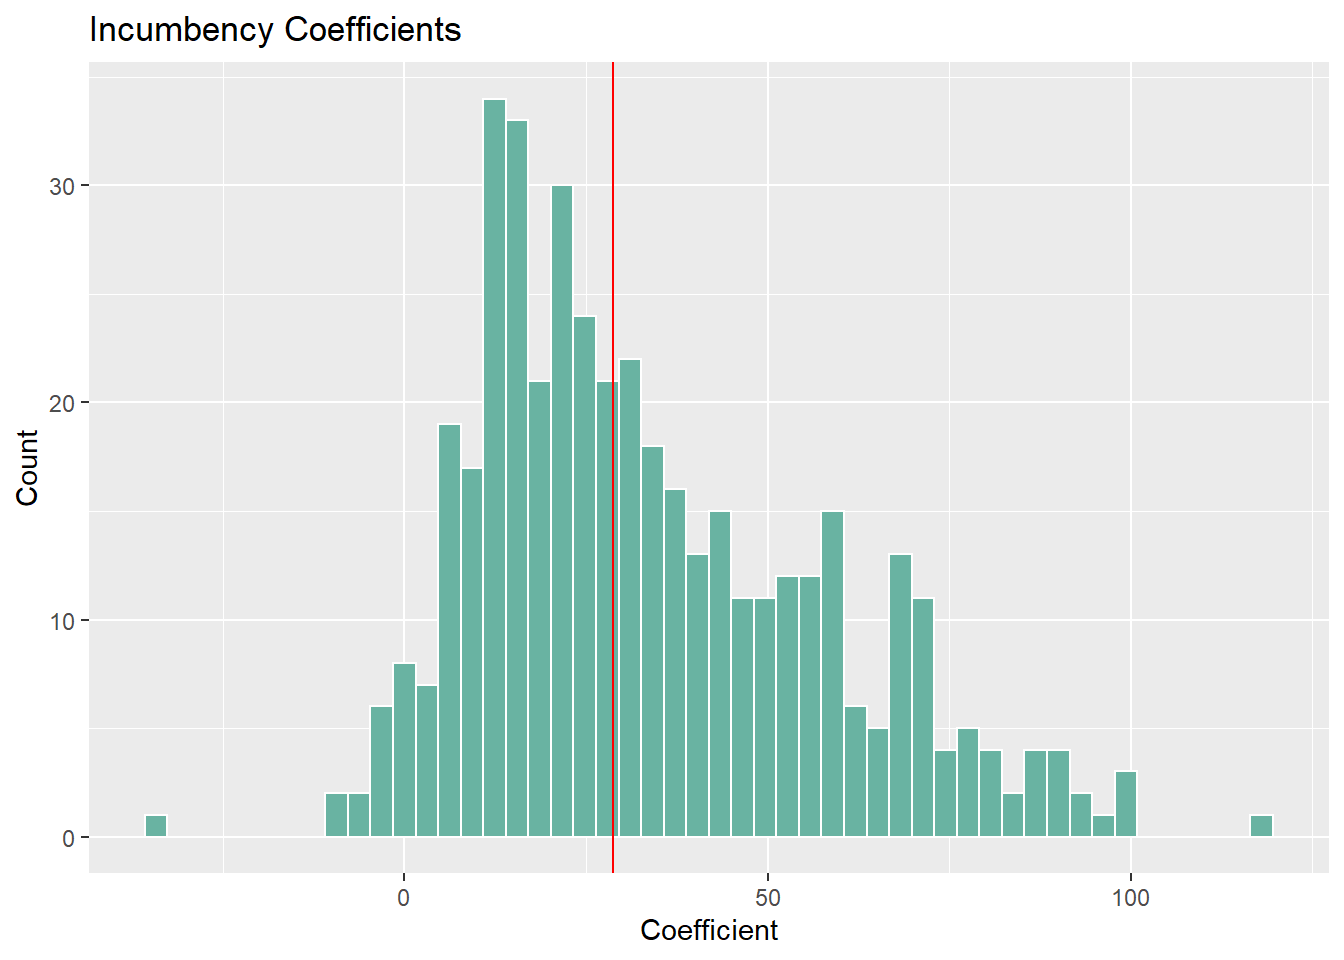
Looking at the first histogram, my models predict that candidates from the sitting president’s party benefit from high turnout. Note this doesn’t really tease out any differential effects based on party but at the very least we’ll look at the overall prediction for 2022 later. Looking at the second histogram, we get some surprising results. Being an incumbent from the president’s party is almost always positive electorally, but there is a ton of variance when it comes to the size of these coefficients. This lines up with evidence that incumbency is a powerful advantage, but I’m not sure what to make of these effects.
Let’s look at p-values next:
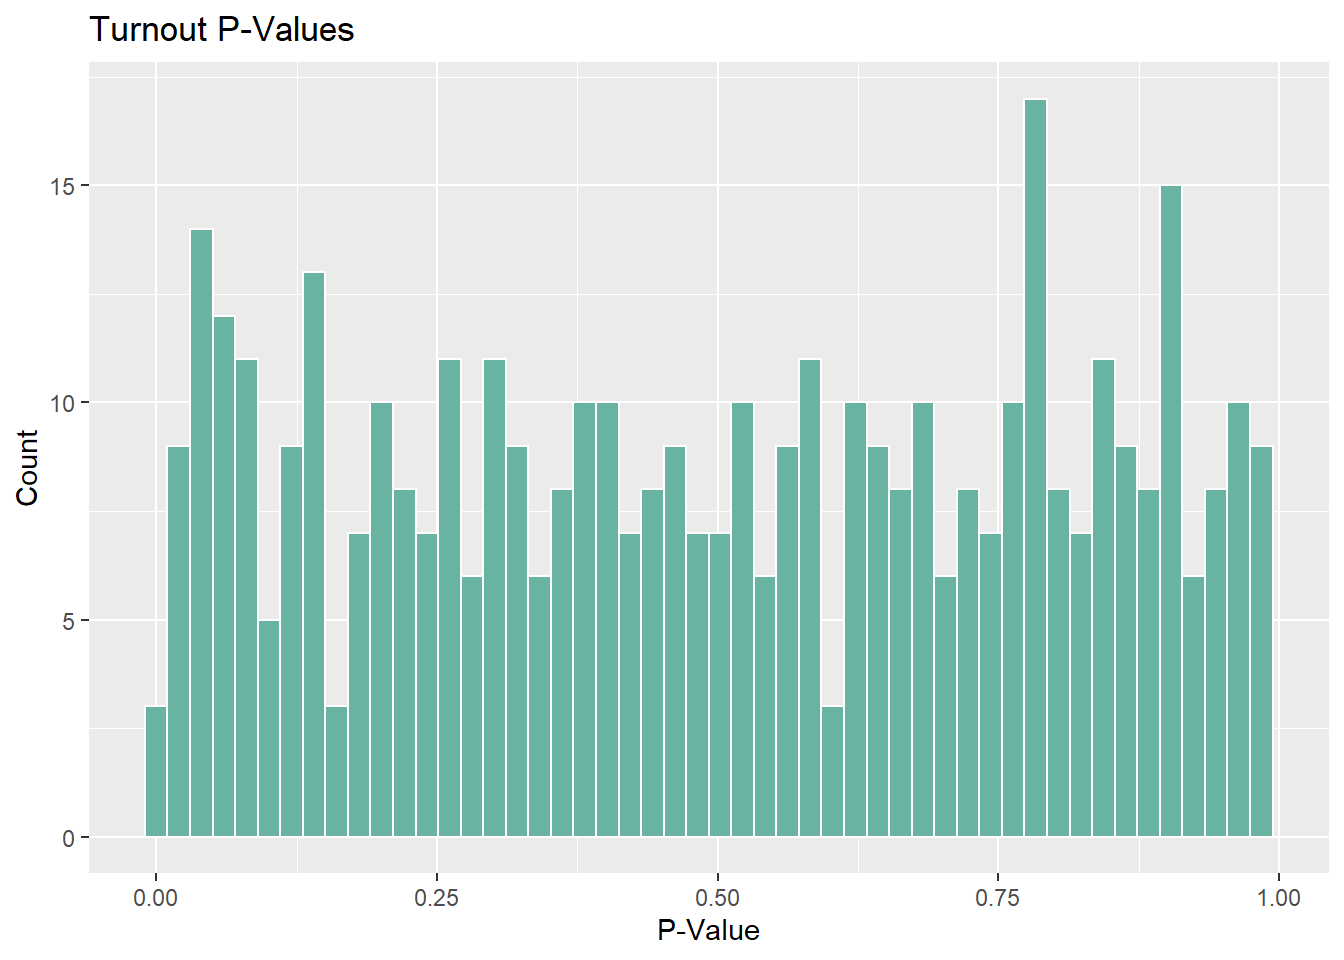
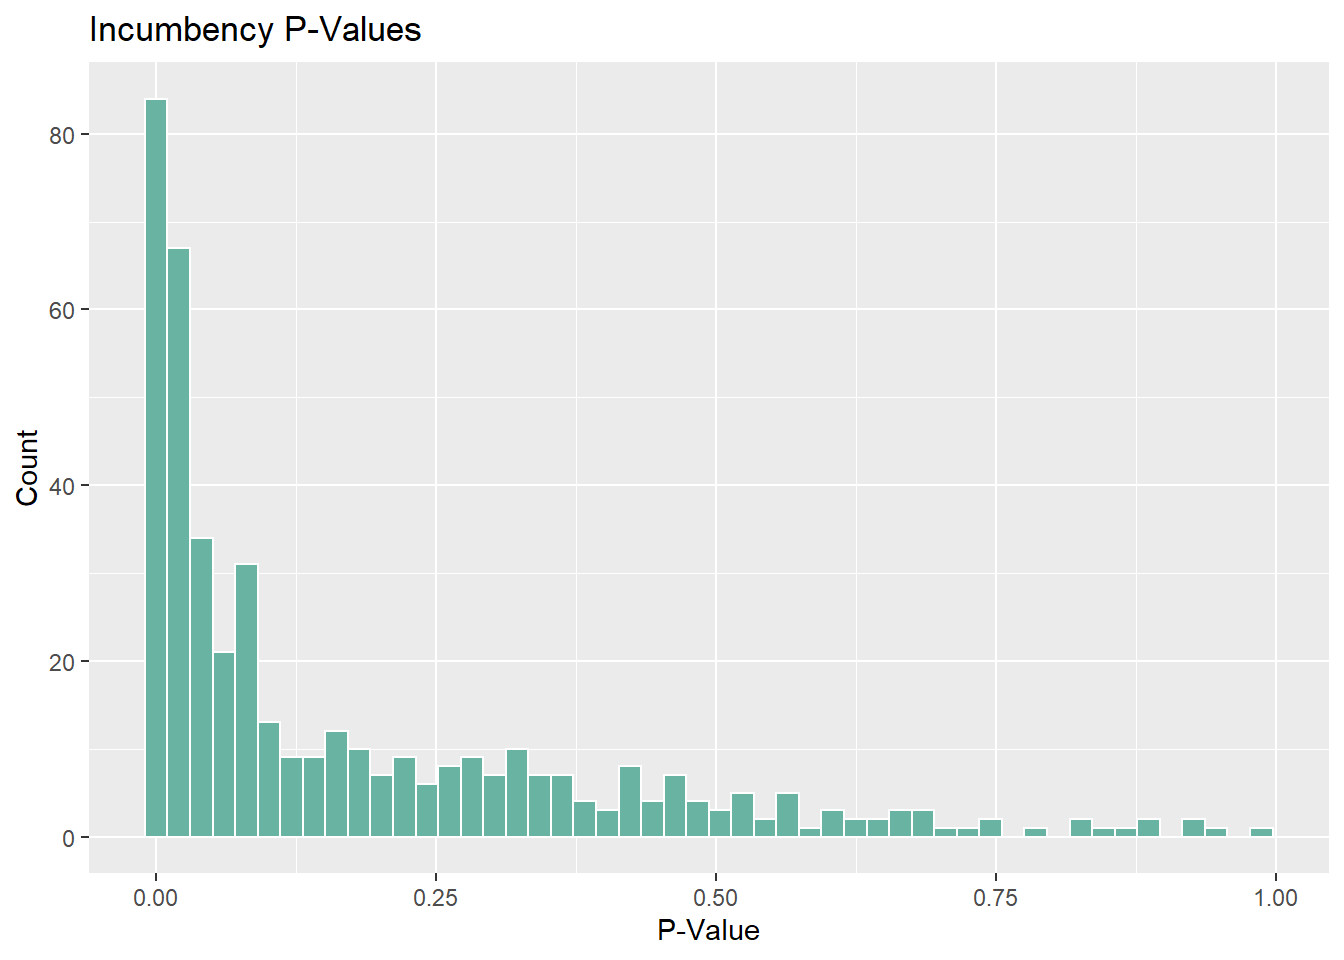
Surprisingly, there are a fair number of districts for which turnout has strong statistical significance. There are many more with little to no significance, but this is really interesting to me. If I had more time I’d look into which districts these are but for now I’ll just let the histogram do the talking. As expected, incumbency is a very strong predictor as we have seen for many weeks now.
Predicting with a pooled model
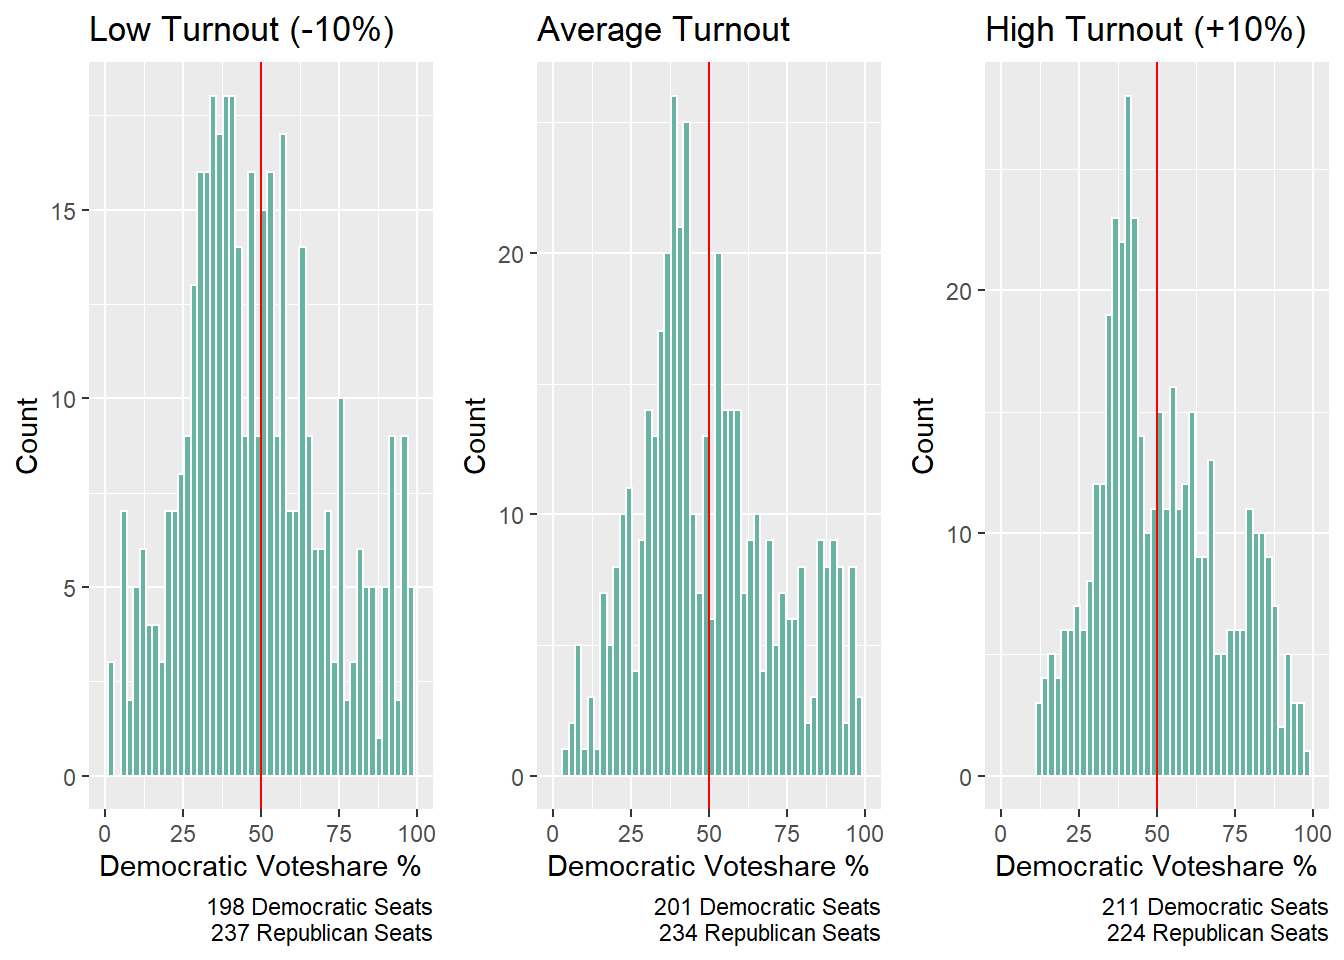
I decided to look at 3 different turnout scenarios to see how my model behaved in each scenario. First, I calculated the average turnout in each district during prior midterm years and created high and low turnout values by adding or subtracting 10 percentage points. I then ran a model for each district and aggregated the results, tallying up the seats that Democrats won in order to get final seat counts. While my p-values were all over the place, I think this is a really interesting result nonetheless. While low turnout and average turnout have very similar seat totals, high turnout nets the Democrats an extra 10 seats. I don’t really trust this prediction but it’s a really interesting proof of concept for me. I’ll continue to improve it in coming weeks to see if I can get something that has some predictive power at the district level, barring redistricting issues.