on
Blog Post 9: Post-Election Reflections
This week I’ll be reflecting on my model’s results now that the House midterm election is mostly concluded.
Recap
My final model was a linear regression model using national data from 1954-2020 in order to predict House seatshare of the sitting president’s party following the House midterm elections. I predicted that the Democrats would win 48.58% of the seats in the House, which translated to about 211 seats for the Democrats and 224 seats for the Republicans. To make this prediction, I used the following as input variables: house majority party, midterm election status, Q7 GDP growth percent, generic poll support, and previous seatshare. You can find a more detailed breakdown of my model in my previous blog post.
Accuracy
At the time of writing this post, Democrats hold 212 seats and Republicans hold 218 seats in the House, leaving 5 seats uncalled. These seats correspond to the following districts: CA-3, CA-13, CA-22, CO-3, and AK-1. Of these uncalled districts, AK-1 will be won by Democrats once Alaska’s ranked-choice measure comes into effect on November 23rd. The three California districts will likely be won with a small margin by Republicans, and Colorado’s 3rd district currently favors the Republicans with a minuscule 50.1% lead. If we assume the current front-runners in each of these districts maintain their current leads, Democrats will control 213 seats in the House and Republicans will control 222 seats in the House, meaning that my model would be off by 2 seats, or about 0.46% seatshare. Since I am already off by 1 seat in my prediction, our lowest seat error would be about 0.23% seatshare. Our highest seat error would be 6 seats or about 1.38% seatshare. Below is a table that summarizes these errors:
| Error Metrics for National Seatshare Model | |
| Metric | Value |
|---|---|
| Lowest Seat Error | 0.229885 |
| Assumed Seat Error | 0.459770 |
| Highest Seat Error | 1.379310 |
| RMSE | 3.409698 |
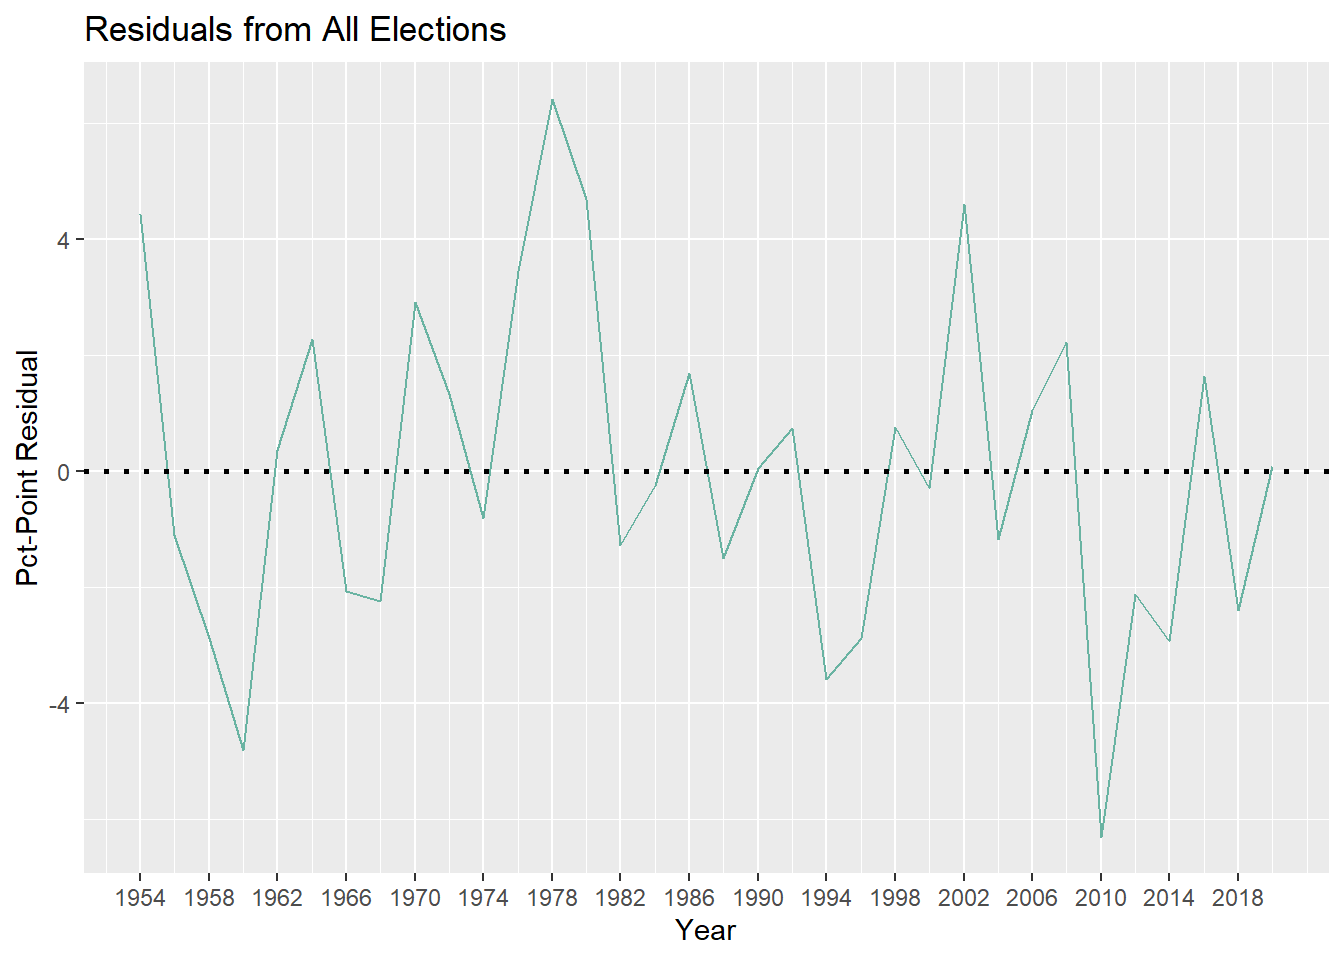
Another way we can assess accuracy is to look at the differences between our observed values and our predicted values, i.e. residuals. Below is a plot of my model’s residuals for all elections from 1954 to 2020:
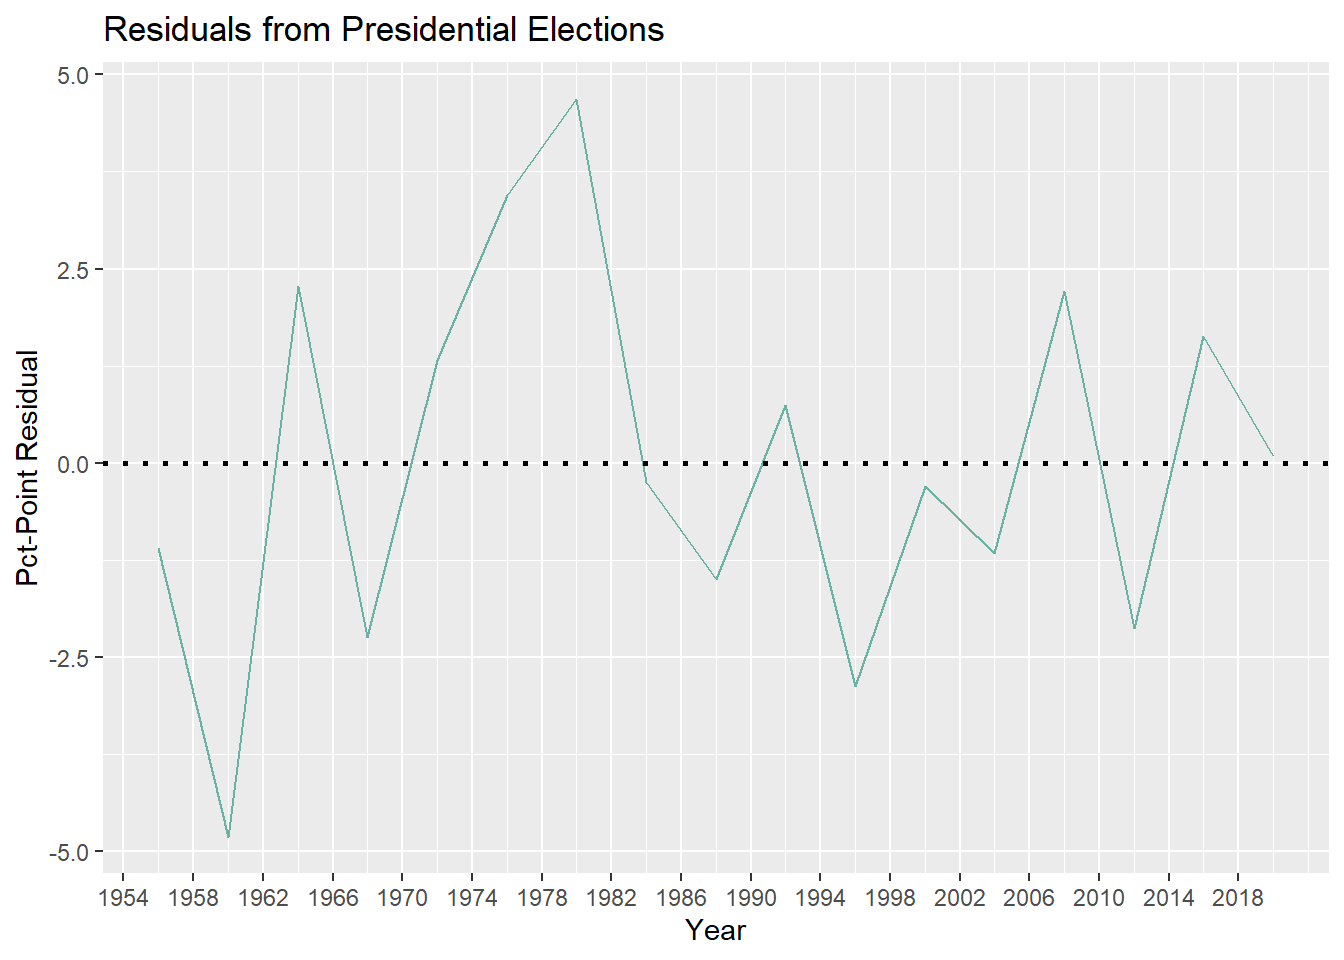
Next is presidential elections only:
And next is midterm elections only:
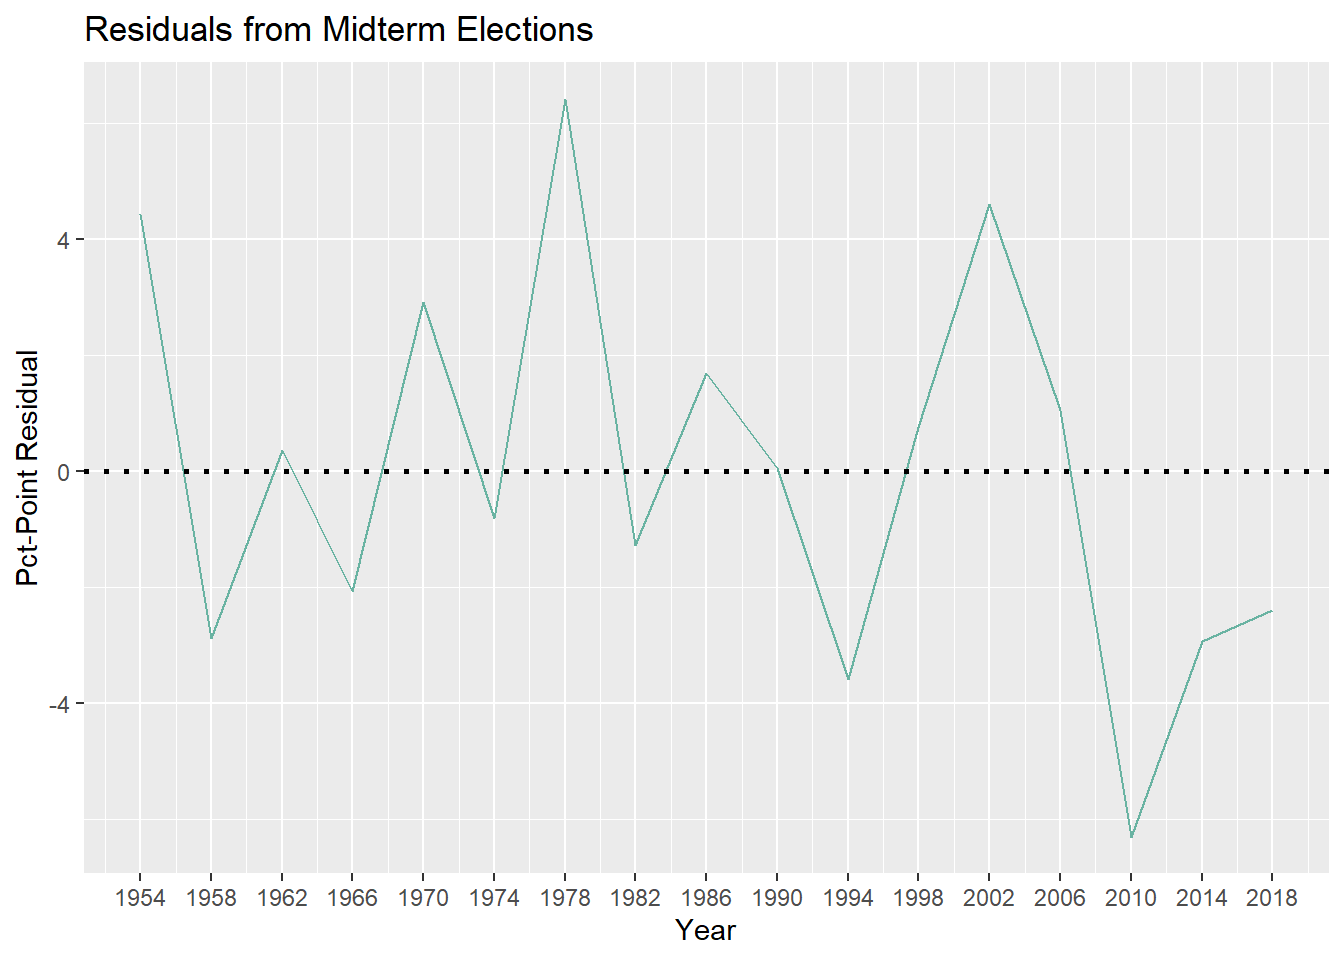
Keeping in mind that negative residuals correspond to my model overestimating seatshare and positive residuals correspond to my model underestimating seatshare, it’s interesting to see that my model overestimated seatshare of the sitting president’s party for the past 3 midterm elections, but underestimated it for this year. While it is only a difference of 0.23% to 1.38% seatshare, this is still a pretty significant change, so why did this happen?
Potential Sources of Inacurracy
I believe that there are three potential reasons as to why my model was inaccurate this midterm election by means of underestimation as opposed to overestimation like the past 3 midterms:
- GDP Growth: As discussed last week, my model predicts an inverse relationship between GDP growth and seatshare, which is troubling given existing literature and conventional wisdom surrounding this relationship. Generally speaking, we would expect voters to reward incumbents for good economic performance, not punish them. The past 3 midterm elections saw Q7 GDP growth ranging between 0.53% and 1.22%. This year’s midterm saw Q7 GDP growth of 2.6%—almost double that of the highest Q7 GDP growth in the last 3 midterm elections. With higher than usual GDP growth, my model very well could have underestimated the electoral performance of the Democrats this election. I think that voters reward incumbents for good performance, but since the GDP is always growing on average, my model may have been thrown off by years where incumbents got punished for lower than normal GDP growth that wasn’t negative. In order to test this hypothesis, I would control for mean Q7 GDP growth when looking at the relationship between GDP growth and House seatshare.
- The Dobbs Decision: As I learned in previous weeks, it is incredibly difficult to operationalize shocks and other political events and incorporate them into a predictive model. This is not to say that political events do not matter. The Dobbs decision will likely be the biggest disruption to previously-established constitutional rights of our lifetime, with unimaginable legal and bodily consequences. Given existing research on differential issue-ownership between the two parties and the Democrats being the pro-choice party opposed to the Dobbs decision, I believe this decision had enough of an affect to persuade voters to turnout for the Democrats who wouldn’t have previously. Since this type of data wasn’t included in my model, I think it underestimated Democratic seatshare by consequence. In order to test this hypothesis, I would want to look at exit polls to see if abortion rights was a higher priority for voters this election as opposed to previous ones, especially for voters in more competitive districts. While rhetoric surrounding abortion has certainly gotten more incendiary over the years, the national legal framework surrounding abortion hasn’t changed much between the Roe v. Wade decision and the Dobbs decision. If Dobbs influenced this election and gave the Democrats a boost, I would expect to see a lot more people talking about abortion rights in the exit polls this year.
- Youth Turnout: I didn’t end up including turnout in my model as I felt that gerrymandering and redistricting had too much power over how much turnout can affect electoral outcomes. In order to include turnout in a way that would take gerrymandering and redistricting into account, I would have had to restrict my dataset into too few observations, which is a tradeoff that I didn’t want to make. That said, media coverage of this midterm election suggests that youth turnout played a significant role in preventing a Democratic blowout. While there is still disagreement over how much of an effect younger voters had, there is a lot of historical data that suggests younger voters are more liberal than older voters. Since I didn’t include turnout data, my model did not take this surge of youth turnout into account and likely underestimated Democratic seatshare. To test this hypothesis, I would want to look at national turnout broken down into age groups, examining younger voters’ political preferences and seeing if increased youth turnout corresponds to increased seatshare for the Democrats.
Potential Changes to my Model
Looking back, I think the main thing I’d want to change about my model is make predictions district-by-district in order to aggregate a national seat prediction. There was better data available at the national level and I was able to ignore the ever-looming spectre of redistricting to a certain extent, but there is a lot less interesting insight to be gleaned from a national-level prediction such as mine. If I had predicted each district individually, I would have been able to look at differences in classification accuracy across districts, see how a given predictor has varying effects across districts, and have generally more actionable results. I think it would have been more fun to have a prediction for all 435 House races, but at the same time there could be a lot more sensitivity to noise at the district level than the national level. At the end of the day the structure of my model was a tradeoff that I made but sometimes I just want to have it both ways.